Fig. 11
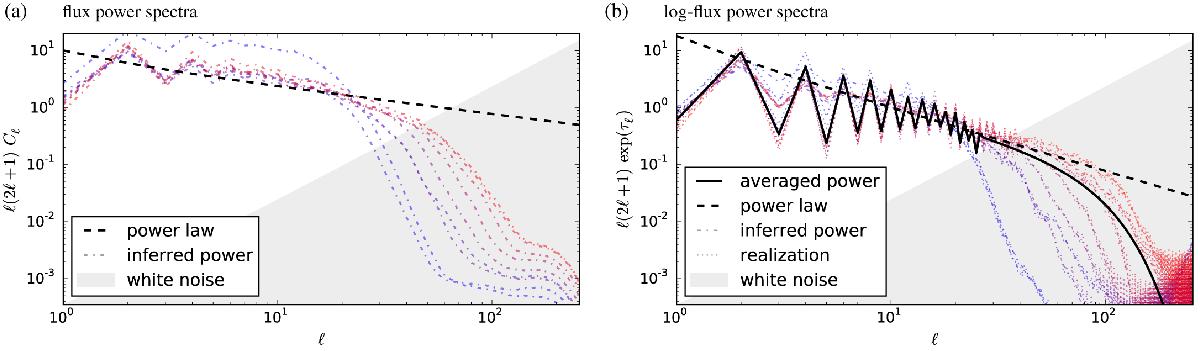
Angular power spectra over angular quantum number ℓ. Panel a) shows the inferred spectra of the diffuse photon flux φ(s) in each energy band and a power-law fit thereof, cf. legend. Panel b) shows the direct realization spectra of the diffuse signal s = log (φ(s)/φ0) and the inferred, fitted, and averaged spectra, cf. legend. The colors (from red to violet to blue) indicate energy (from band 1 to 9) in both panels, and a white noise spectrum with arbitrary normalization is included for comparison.
Current usage metrics show cumulative count of Article Views (full-text article views including HTML views, PDF and ePub downloads, according to the available data) and Abstracts Views on Vision4Press platform.
Data correspond to usage on the plateform after 2015. The current usage metrics is available 48-96 hours after online publication and is updated daily on week days.
Initial download of the metrics may take a while.