Fig. 1
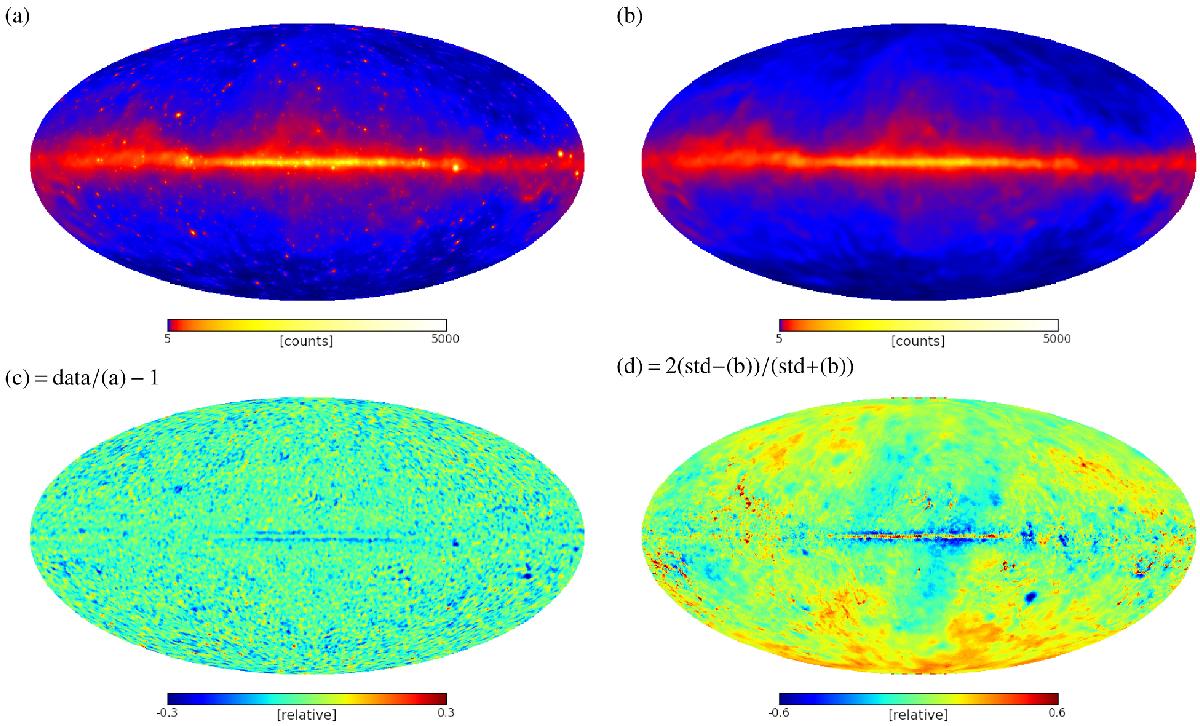
γ-ray sky seen by the Fermi LAT in a Mollweide projection. Panel a) shows the (total) photon flux reconstructed from photon count data of 6.5 years mission elapsed time in the energy range from 0.6 to 307.2 GeV reconvolved with the LAT’s IRFs. Panel b) shows solely the reconvolved diffuse contribution. Panel c) shows the fractional residual map between data and reconstruction smoothed with a 0.5° Gaussian kernel. Panel d) shows the fractional difference map between the standard total, Galactic plus isotropic, diffuse model (short “std”) and the reconstructed diffuse contribution.
Current usage metrics show cumulative count of Article Views (full-text article views including HTML views, PDF and ePub downloads, according to the available data) and Abstracts Views on Vision4Press platform.
Data correspond to usage on the plateform after 2015. The current usage metrics is available 48-96 hours after online publication and is updated daily on week days.
Initial download of the metrics may take a while.