Fig. 8
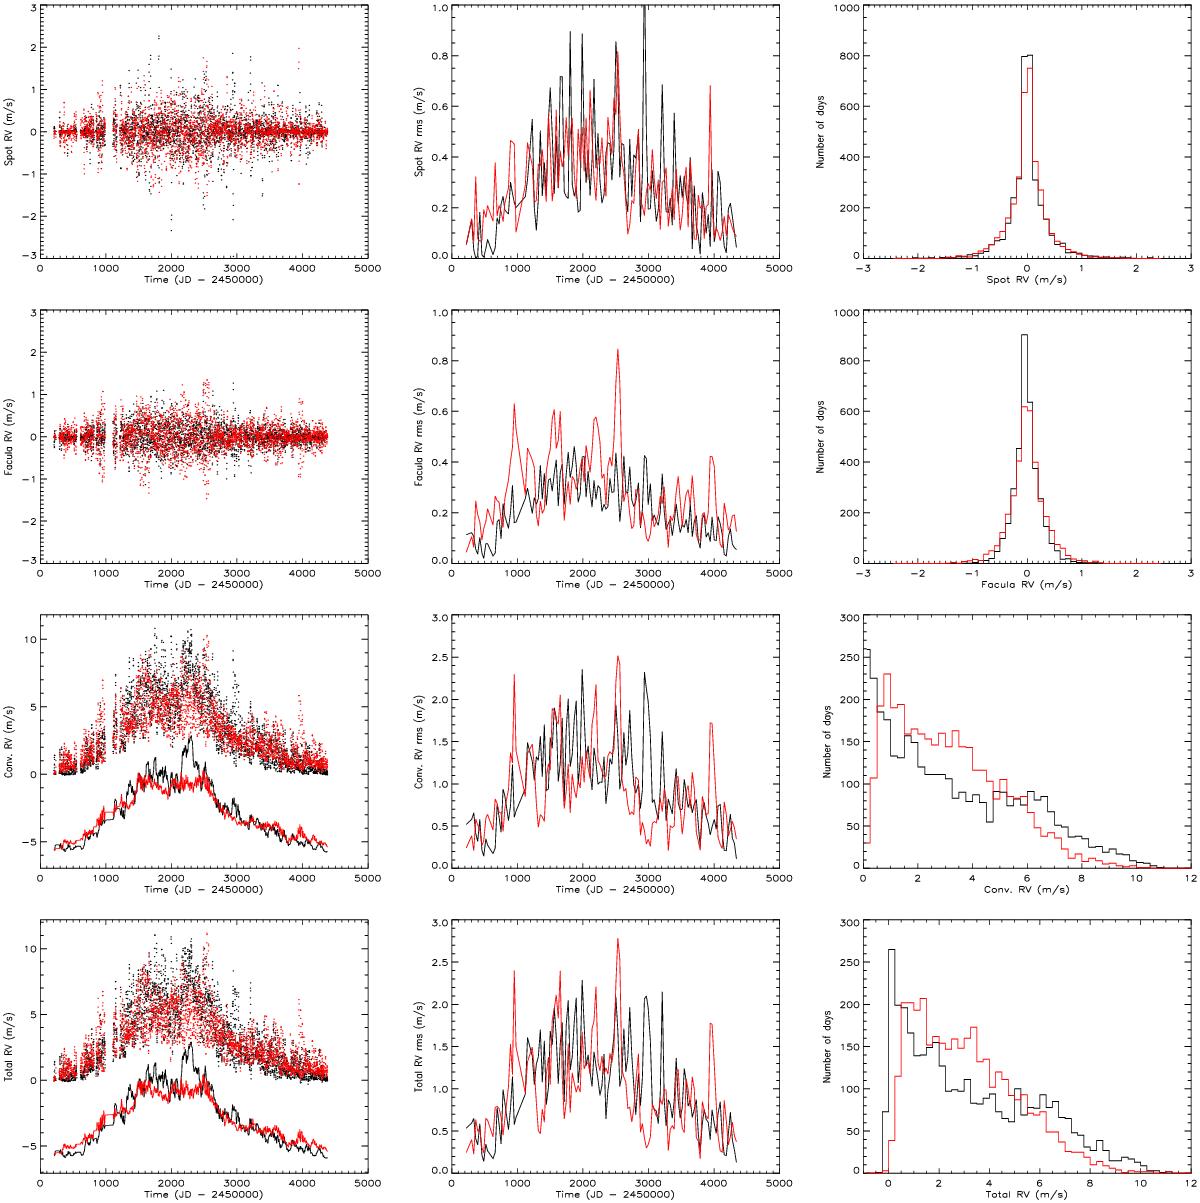
From top to bottom: spot, facula, convection and total contribution to the RV time series, reconstructed from observations (black; same activity pattern as in Paper II) and simulated with our model (red). Left: RV time series (dots). The timescale is the same as in Paper II. For the convection and total contributions, the RV time series averaged over 30 days are also shown (solid line), with an offset for better visibility. Middle: rms of the RV over 30-day intervals. Right: histograms of the RVs.
Current usage metrics show cumulative count of Article Views (full-text article views including HTML views, PDF and ePub downloads, according to the available data) and Abstracts Views on Vision4Press platform.
Data correspond to usage on the plateform after 2015. The current usage metrics is available 48-96 hours after online publication and is updated daily on week days.
Initial download of the metrics may take a while.