Fig. 6
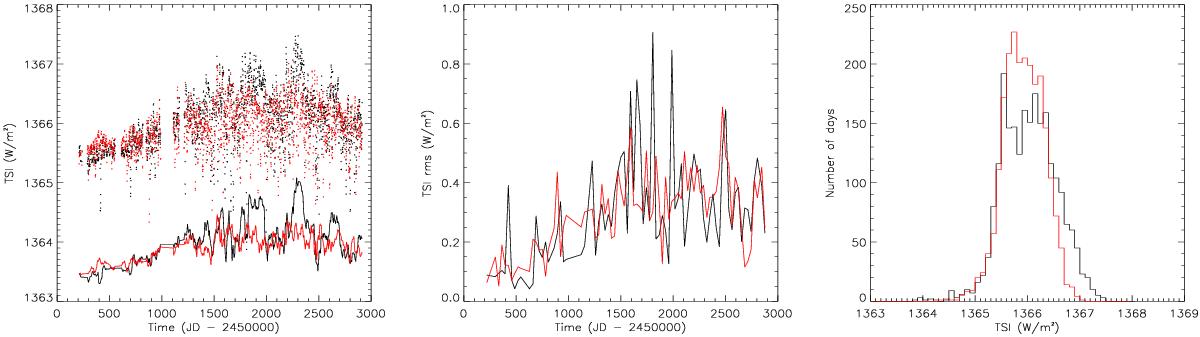
Left: observed TSI from Fröhlich & Lean (1998; black) and reconstructed photometric contribution from all simulated structures (red). The photometric time series (dots) are given as well as their average over 30 days (solid line), with a vertical offset on the latter for visibility. Middle: rms of the photometric time series over 30-day intervals. Right: histograms of the photometric time series.
Current usage metrics show cumulative count of Article Views (full-text article views including HTML views, PDF and ePub downloads, according to the available data) and Abstracts Views on Vision4Press platform.
Data correspond to usage on the plateform after 2015. The current usage metrics is available 48-96 hours after online publication and is updated daily on week days.
Initial download of the metrics may take a while.