Fig. 4
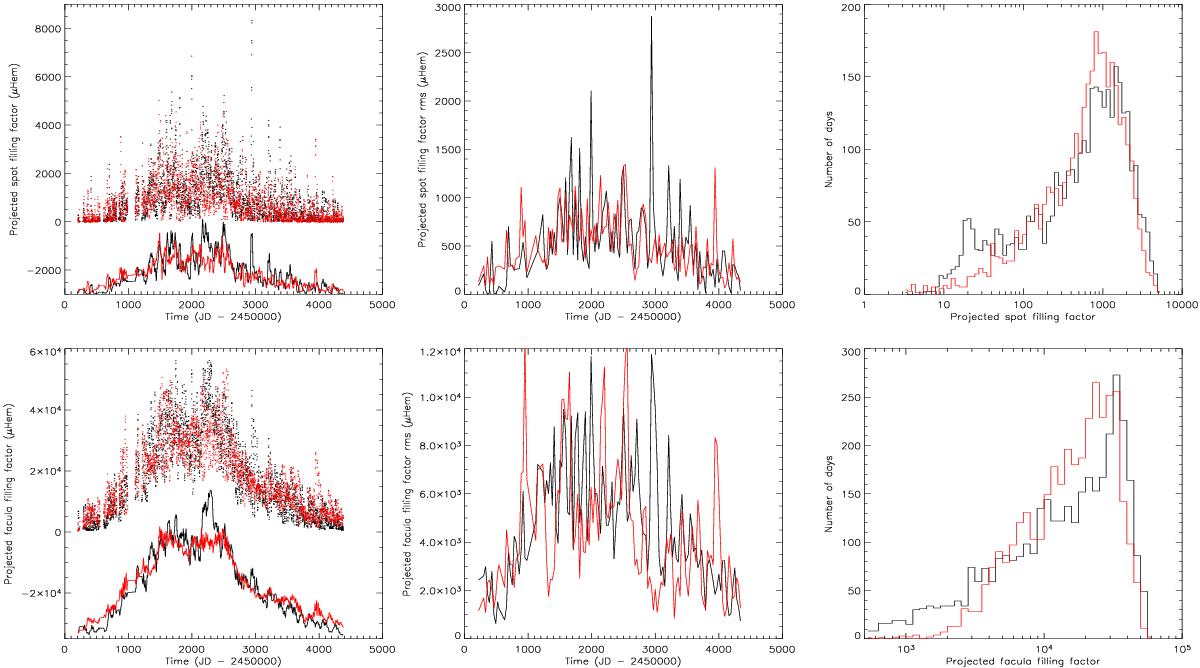
Projected spot (top) and bright feature (bottom) filling factors (in μHem), for observed (black) and simulated (red) structures. Left: projected filling factor time series (dots) and averaged over 30 days (solid lines). Note that a vertical offset has been put on the averaged curves for visibility. Middle: rms of the projected filling factor over 30-day intervals. Right: histogram of the projected filling factor.
Current usage metrics show cumulative count of Article Views (full-text article views including HTML views, PDF and ePub downloads, according to the available data) and Abstracts Views on Vision4Press platform.
Data correspond to usage on the plateform after 2015. The current usage metrics is available 48-96 hours after online publication and is updated daily on week days.
Initial download of the metrics may take a while.