Fig. 17
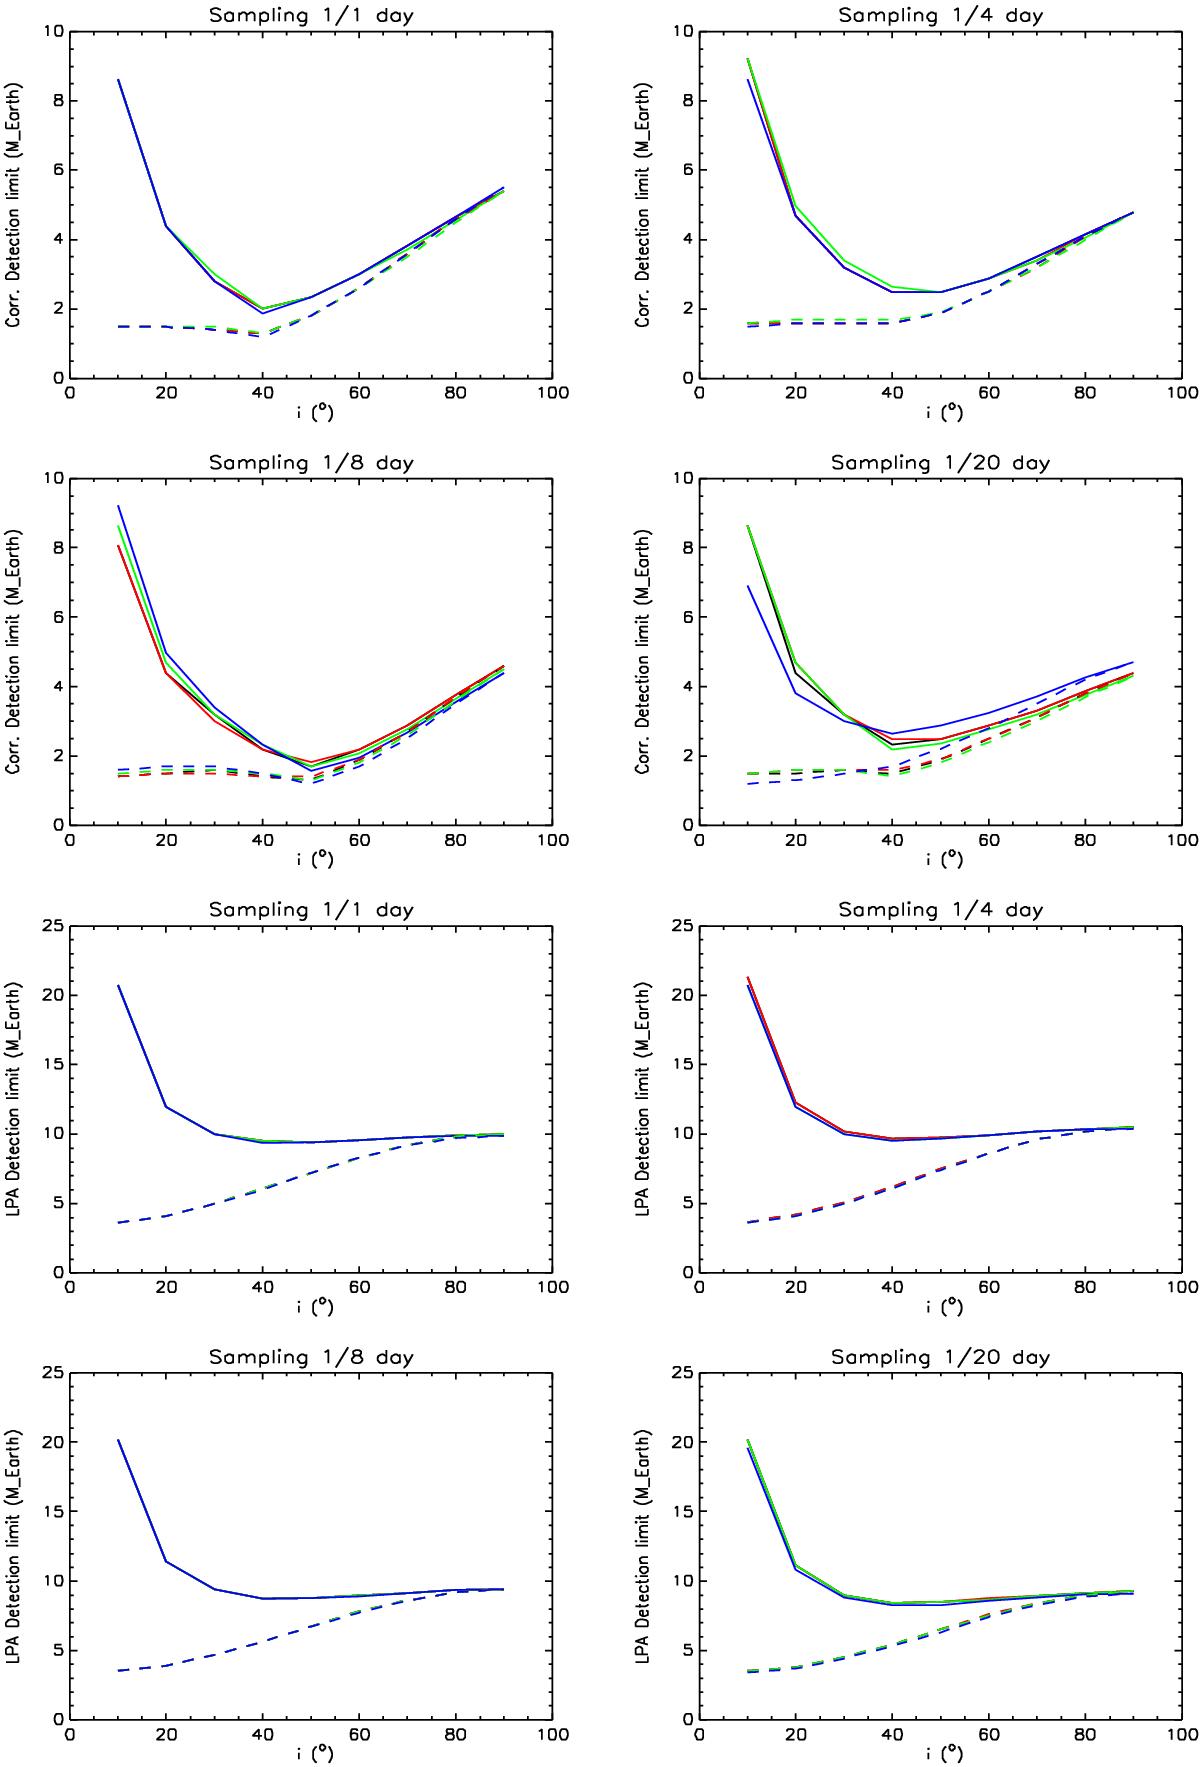
Detection limits versus stellar inclination for the correlation-based (four top panels) and the LPA (four bottom panels) methods. The detection limits are displayed for different samplings and for different noise levels (black: no added noise, red: 0.01 m s-1 noise, green: 0.05 m s-1 noise and blue: 0.1 m s-1 noise). Solid line: detection limits computed in case 2. Dashed line: detection limits computed in case 1.
Current usage metrics show cumulative count of Article Views (full-text article views including HTML views, PDF and ePub downloads, according to the available data) and Abstracts Views on Vision4Press platform.
Data correspond to usage on the plateform after 2015. The current usage metrics is available 48-96 hours after online publication and is updated daily on week days.
Initial download of the metrics may take a while.