Fig. 1
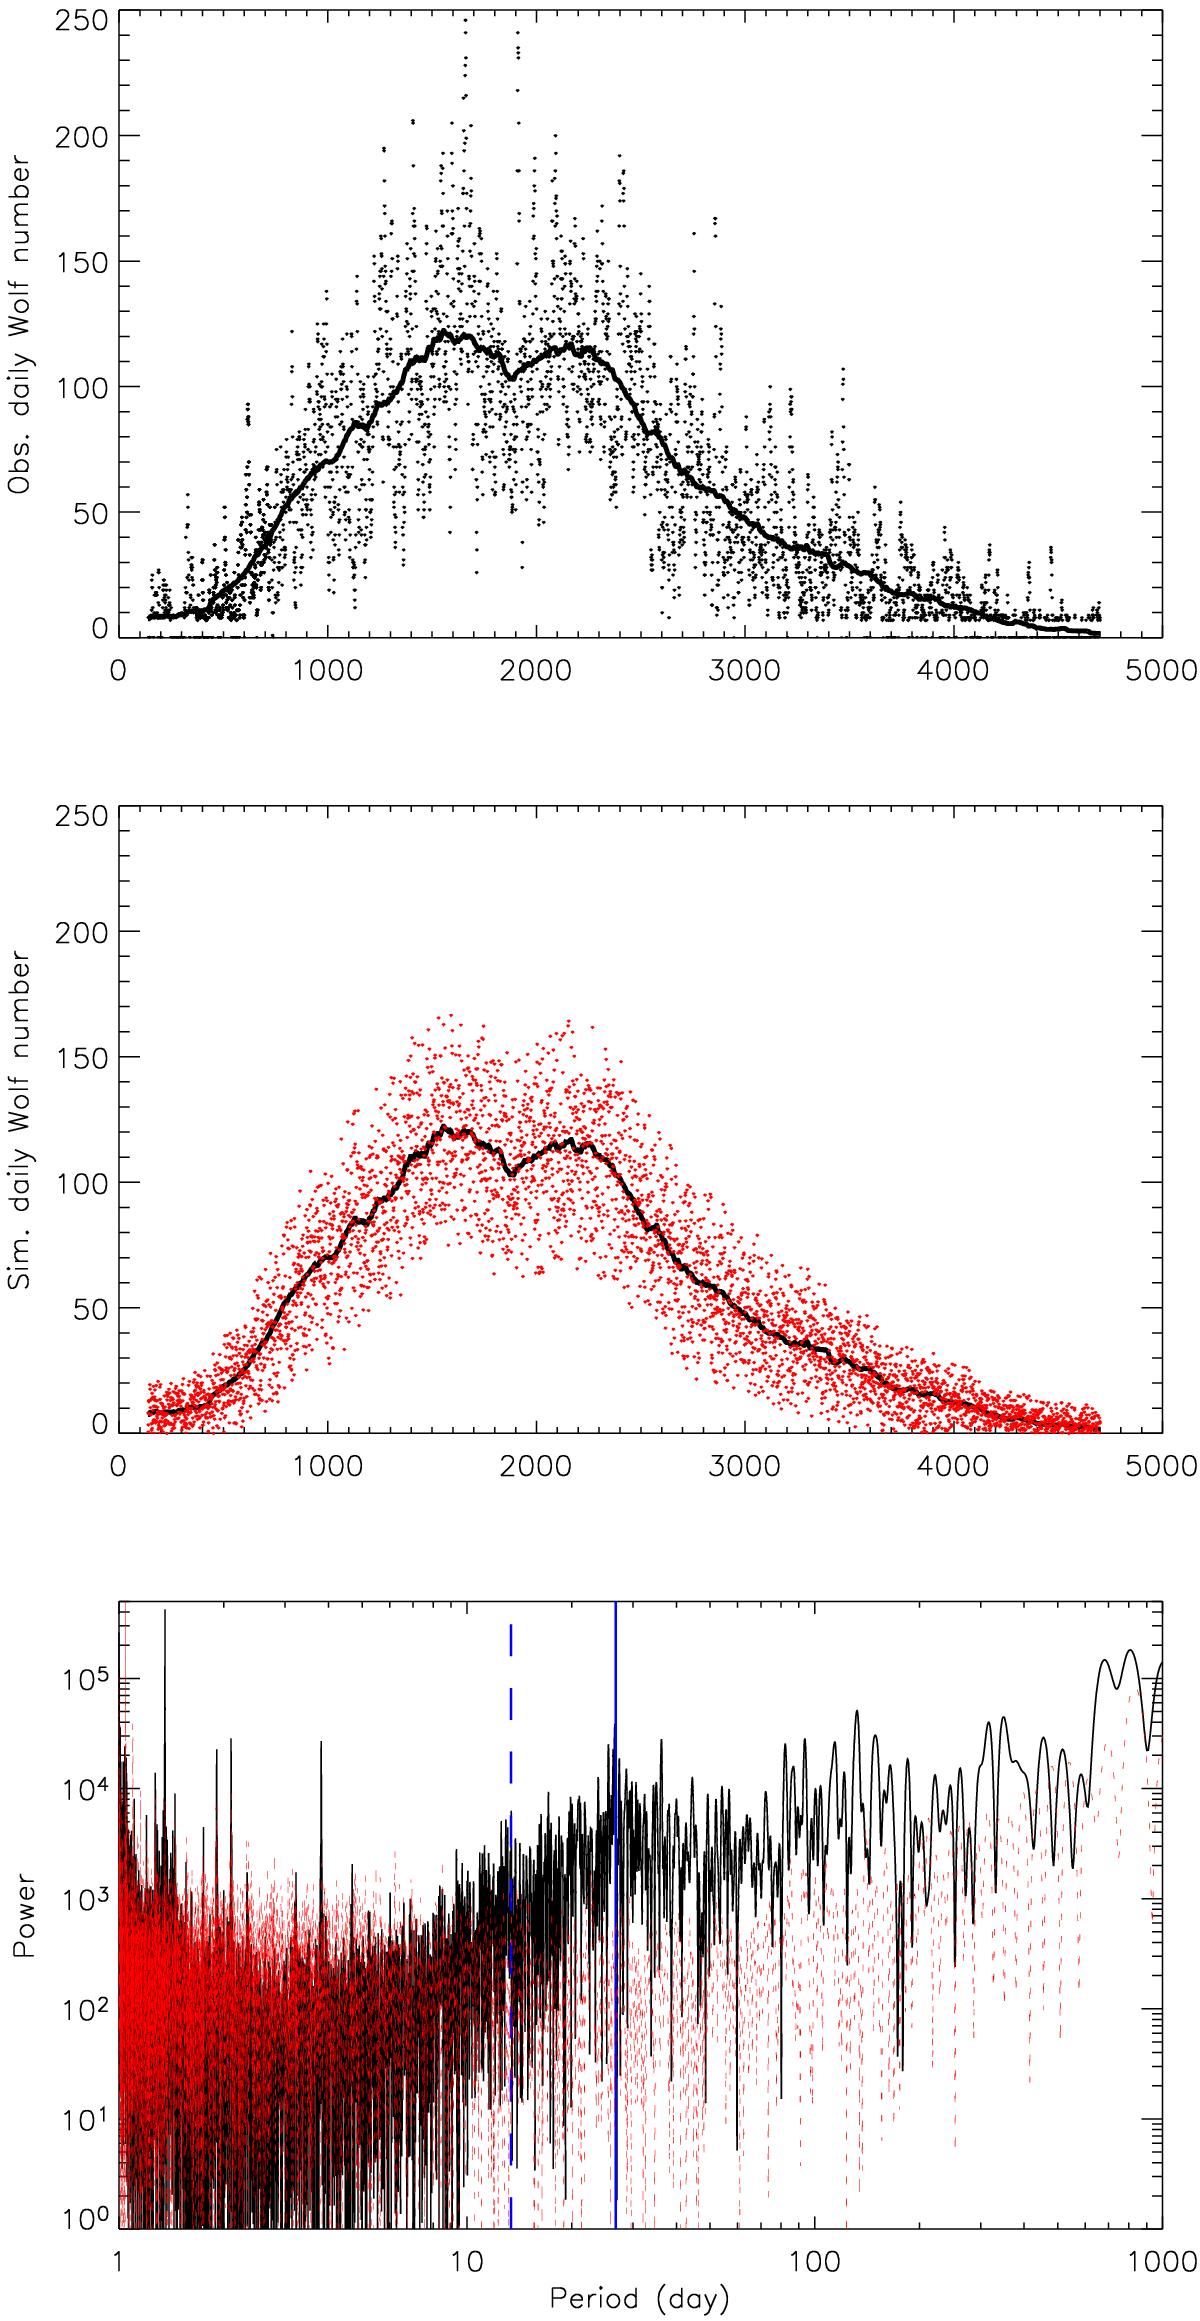
Top: daily (dots) and smoothed (bold line) Wolf number over solar cycle 23. Middle: same smoothed Wolf number (black line), and when randomly adding a second-order polynomial dispersion (red dots). Bottom: power spectra of the observed daily (black) and simulated (red) Wolf numbers (respectively R and R′). The solar rotation period (blue solid line) and its first harmonic (blue dashed line) are also shown for comparison.
Current usage metrics show cumulative count of Article Views (full-text article views including HTML views, PDF and ePub downloads, according to the available data) and Abstracts Views on Vision4Press platform.
Data correspond to usage on the plateform after 2015. The current usage metrics is available 48-96 hours after online publication and is updated daily on week days.
Initial download of the metrics may take a while.