Fig. 9
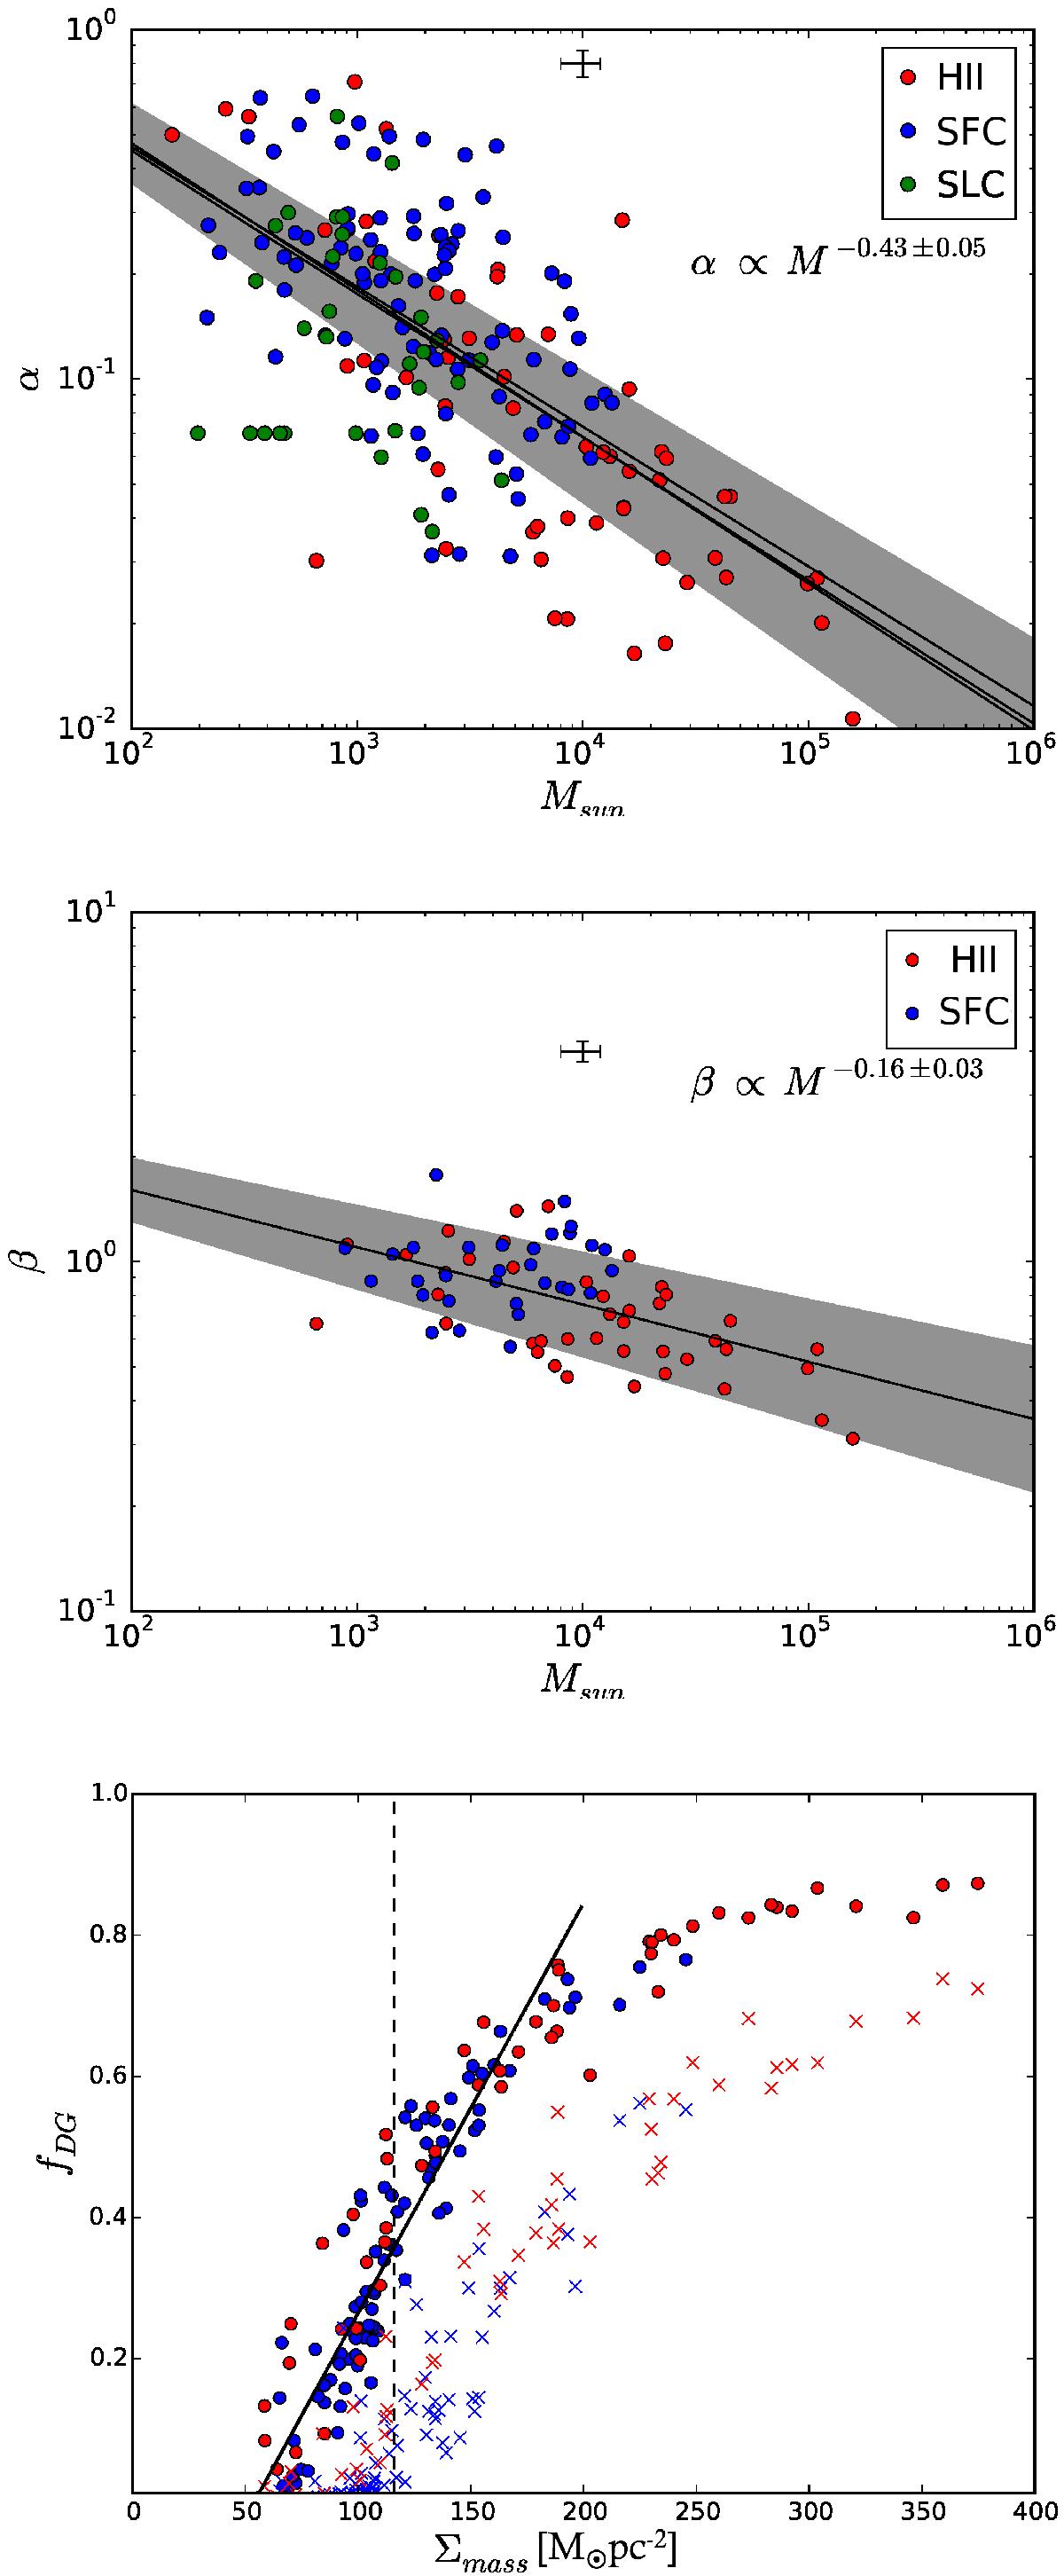
Top: relationship between the mass of the regions [M⊙] and the exponent of the exponential fit to the DGMFs (αexp). Black solid line shows the best fit to the data and the shaded region shows its σ error. The dotted and dashed lines show the best fit when the most massive H ii regions are removed. Colors indicate the evolutionary class of each point as indicated. Middle: relationship between mass of the regions and the slope of the power-law range of the DGMFs. Black line shows the best fit to the data and the shaded region shows its σ error. Bottom: relationship between the mean gas mass surface density of the MCs, Σmass, and the dense gas mass fraction of gas, ![]() . The crosses show the fDG obtained integrating the exponential regime of the DGMFs of each region in the range AV = 0−7 mag (see third paragraph in Sect. 4.2). Black line shows a linear fit to the data in the range Σmass = 50−200 M⊙ pc-2. Vertical dashed line at Σmass = 116 M⊙ pc-2 (Lada et al. 2010, 2012) indicates the threshold for the dense gas.
. The crosses show the fDG obtained integrating the exponential regime of the DGMFs of each region in the range AV = 0−7 mag (see third paragraph in Sect. 4.2). Black line shows a linear fit to the data in the range Σmass = 50−200 M⊙ pc-2. Vertical dashed line at Σmass = 116 M⊙ pc-2 (Lada et al. 2010, 2012) indicates the threshold for the dense gas.
Current usage metrics show cumulative count of Article Views (full-text article views including HTML views, PDF and ePub downloads, according to the available data) and Abstracts Views on Vision4Press platform.
Data correspond to usage on the plateform after 2015. The current usage metrics is available 48-96 hours after online publication and is updated daily on week days.
Initial download of the metrics may take a while.