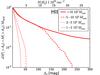
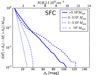
Fig. 8
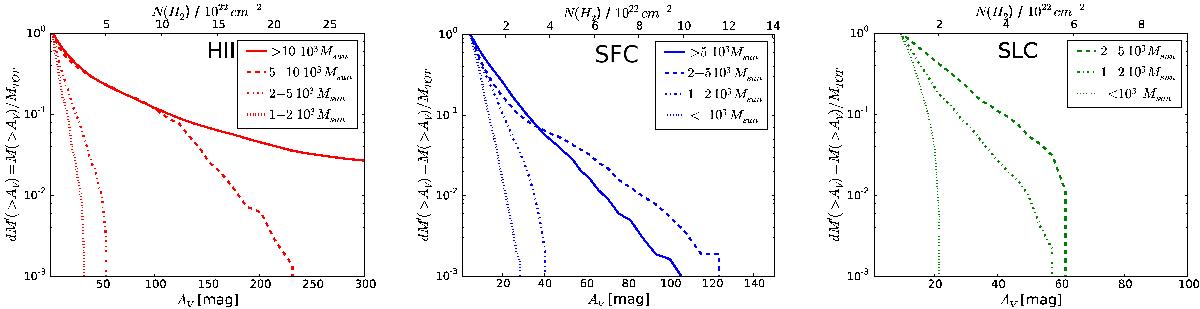
Mass-binned average DGMFs for each evolutionary class. Each line shows the DGMF for each of the mass intervals listed in the corresponding panel and defined in Table 5. Dotted lines, dotted-dashed lines, dashed lines, and solid lines progress from less to most massive bins, respectively. The DGMFs were normalized following the procedure described in Sect. 3.1.2 and shown in Fig. 7.
Current usage metrics show cumulative count of Article Views (full-text article views including HTML views, PDF and ePub downloads, according to the available data) and Abstracts Views on Vision4Press platform.
Data correspond to usage on the plateform after 2015. The current usage metrics is available 48-96 hours after online publication and is updated daily on week days.
Initial download of the metrics may take a while.