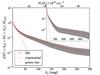
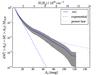
Fig. 7
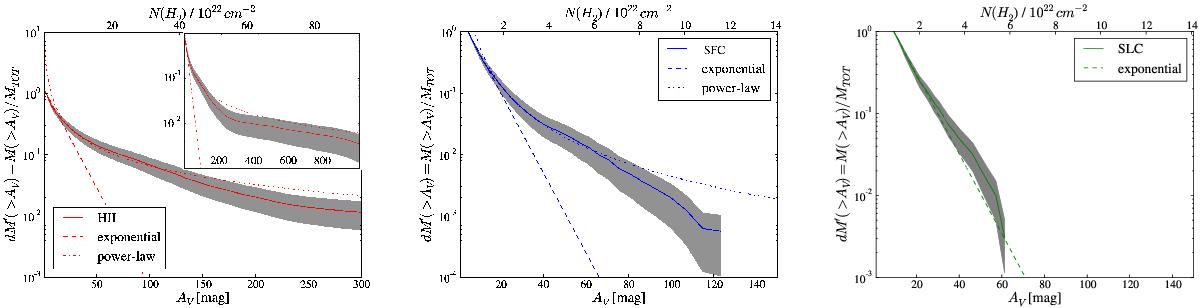
Mean DGMFs of H ii regions (left), SFCs (center) and SLCs (right). Solid colored lines show mean normalized DGMFs. DGMFs were normalized to the reliability limit of each evolutionary class: AV = 2, 4, 9 mag for H ii regions, SFCs and SLCs, respectively. Colored dashed lines show the fit of the DGMFs with exponential functions. Dashed-dotted colored lines show fits with power-law tails in the higher AV range. Grey shaded regions show statistical poisson errors of the DGMFs. Small box in left panel shows the whole mean DGMF of H ii regions up to AV = 1000 mag.
Current usage metrics show cumulative count of Article Views (full-text article views including HTML views, PDF and ePub downloads, according to the available data) and Abstracts Views on Vision4Press platform.
Data correspond to usage on the plateform after 2015. The current usage metrics is available 48-96 hours after online publication and is updated daily on week days.
Initial download of the metrics may take a while.