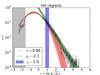
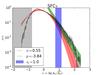
Fig. 6
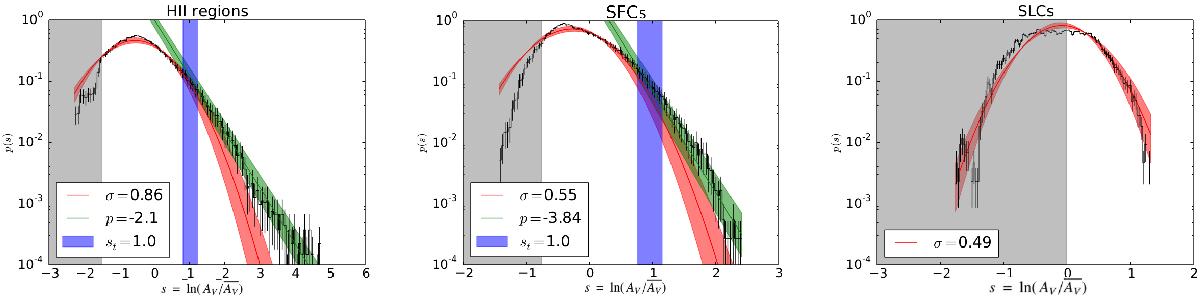
Total mean normalized column density PDFs of H ii regions (left), SFCs (center) and SLCs (right). All panels: horizontal axis show mean normalized column densities, ![]() . Vertical error bars show Poisson standard deviation,
. Vertical error bars show Poisson standard deviation, ![]() . The best-fit curves assuming a combination of log-normal and power-law functions are indicated, respectively, by red and green solid lines, with the fit errors indicated as shaded regions of the same colors. The gray shaded regions indicate data below the reliability limit. These data were excluded from the fit. Blue shaded regions show the range of values obtained for the mean-normalized column density value at which N-PDFs deviate from a log-normal to a power-law like function, st.
. The best-fit curves assuming a combination of log-normal and power-law functions are indicated, respectively, by red and green solid lines, with the fit errors indicated as shaded regions of the same colors. The gray shaded regions indicate data below the reliability limit. These data were excluded from the fit. Blue shaded regions show the range of values obtained for the mean-normalized column density value at which N-PDFs deviate from a log-normal to a power-law like function, st.
Current usage metrics show cumulative count of Article Views (full-text article views including HTML views, PDF and ePub downloads, according to the available data) and Abstracts Views on Vision4Press platform.
Data correspond to usage on the plateform after 2015. The current usage metrics is available 48-96 hours after online publication and is updated daily on week days.
Initial download of the metrics may take a while.