Free Access
Fig. 5
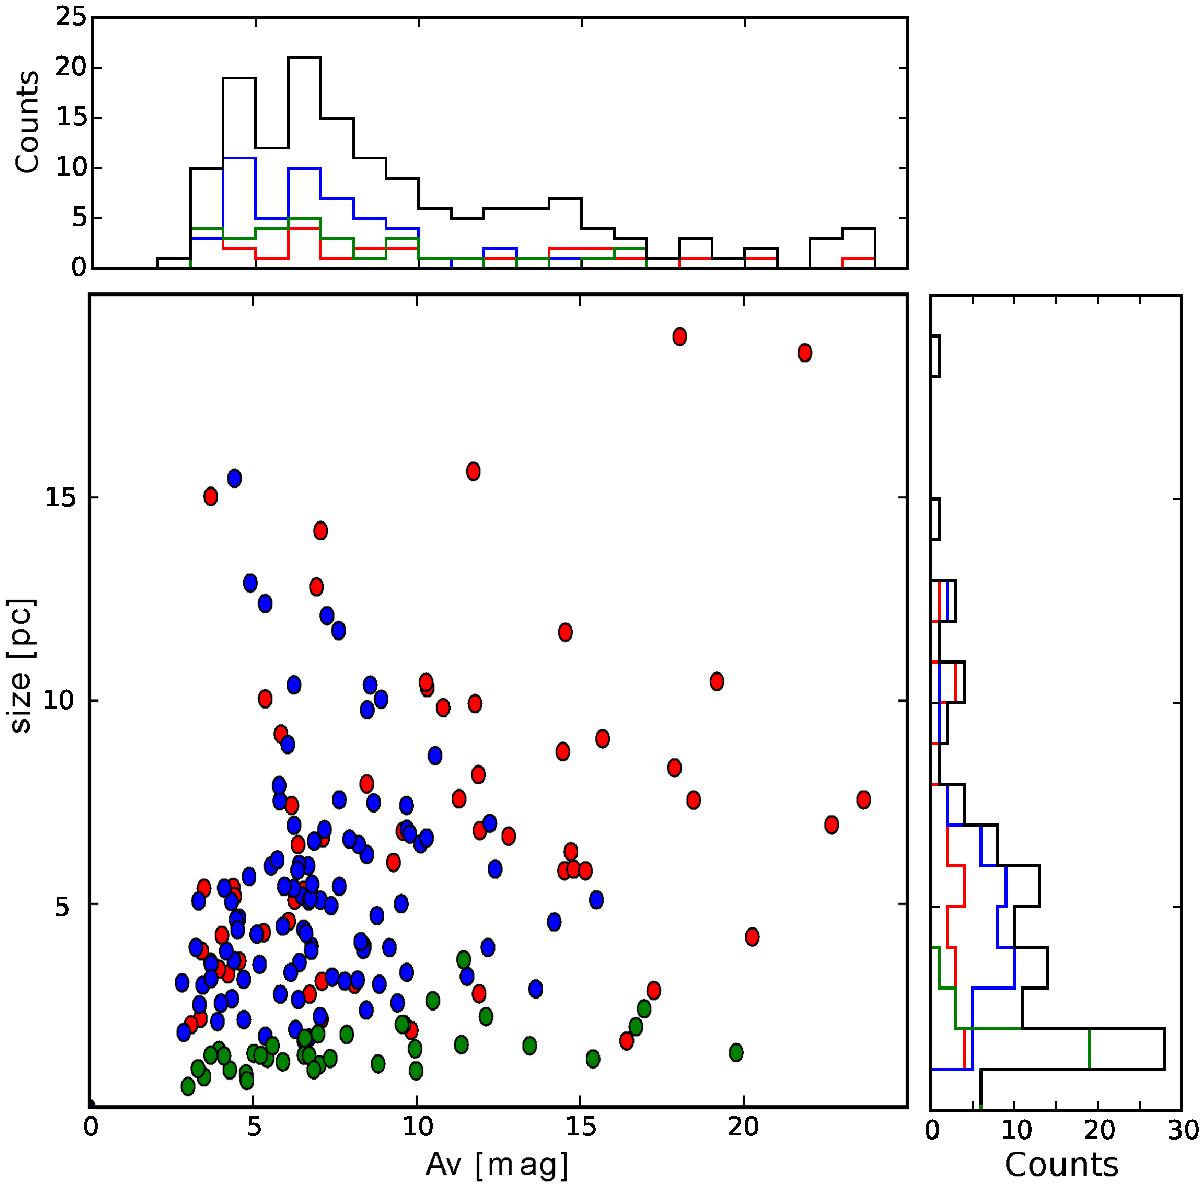
Mean column density, ![]() , and size distribution of all the regions. In the scatter plot we show the H ii regions in red, the SFCs in blue and the SLCs in green. The histograms show the
, and size distribution of all the regions. In the scatter plot we show the H ii regions in red, the SFCs in blue and the SLCs in green. The histograms show the ![]() and size distributions of each evolutionary class (same colors) and the whole sample (black).
and size distributions of each evolutionary class (same colors) and the whole sample (black).
Current usage metrics show cumulative count of Article Views (full-text article views including HTML views, PDF and ePub downloads, according to the available data) and Abstracts Views on Vision4Press platform.
Data correspond to usage on the plateform after 2015. The current usage metrics is available 48-96 hours after online publication and is updated daily on week days.
Initial download of the metrics may take a while.