Fig. 3
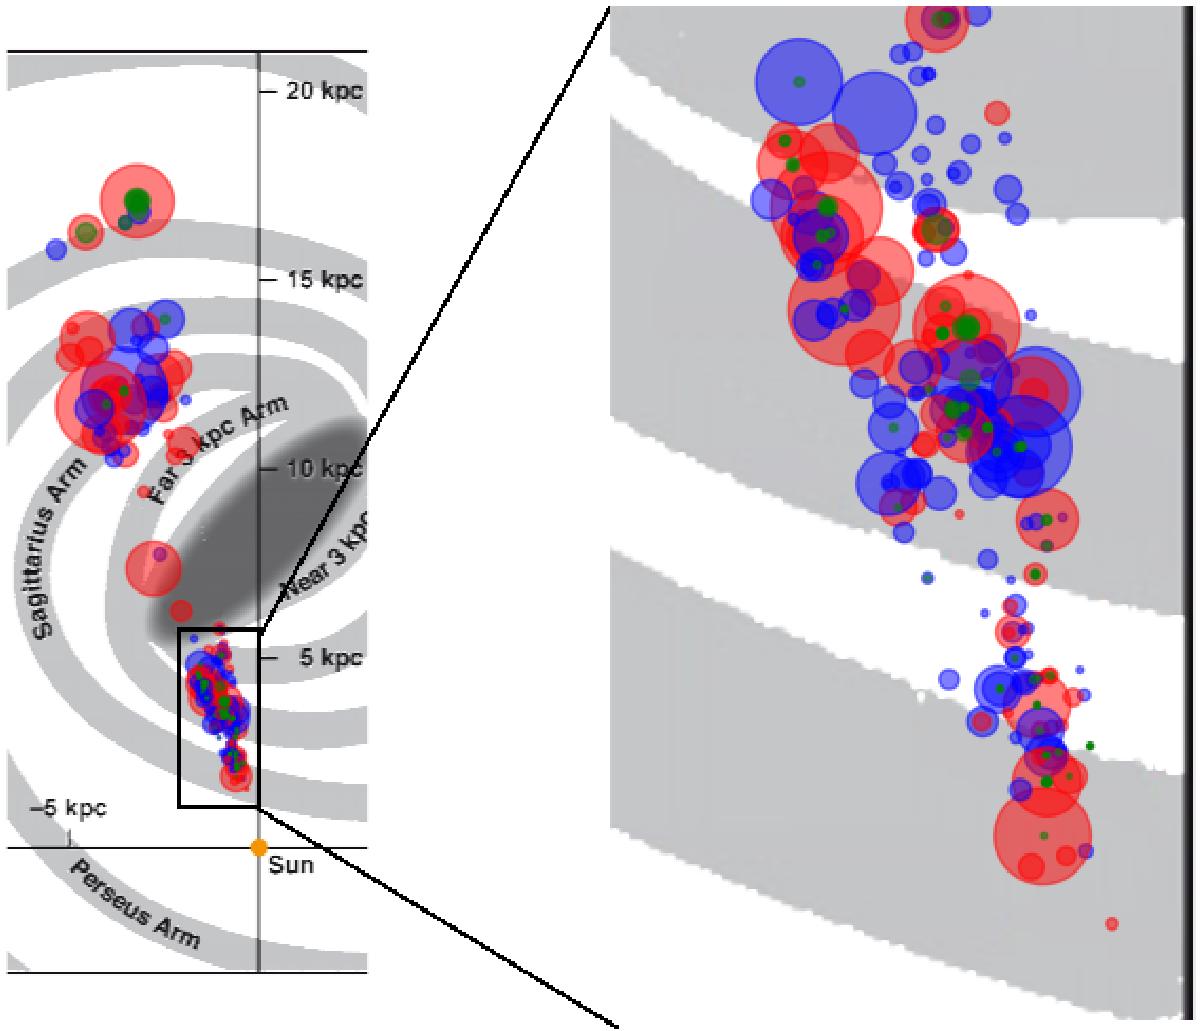
Artist impression of face-on view of the Milky Way (R. Hurt, SSC-Caltech, MPIA graphic, Tackenberg et al. 2012). H ii regions are shown as red circles, star-forming clouds as blue circles and starless clumps as green circles. Circle sizes are proportional to region sizes. The right panel shows a zoom to the region enclosed by the black rectangle in the left panel, where the source density is highest.
Current usage metrics show cumulative count of Article Views (full-text article views including HTML views, PDF and ePub downloads, according to the available data) and Abstracts Views on Vision4Press platform.
Data correspond to usage on the plateform after 2015. The current usage metrics is available 48-96 hours after online publication and is updated daily on week days.
Initial download of the metrics may take a while.