Fig. C.1
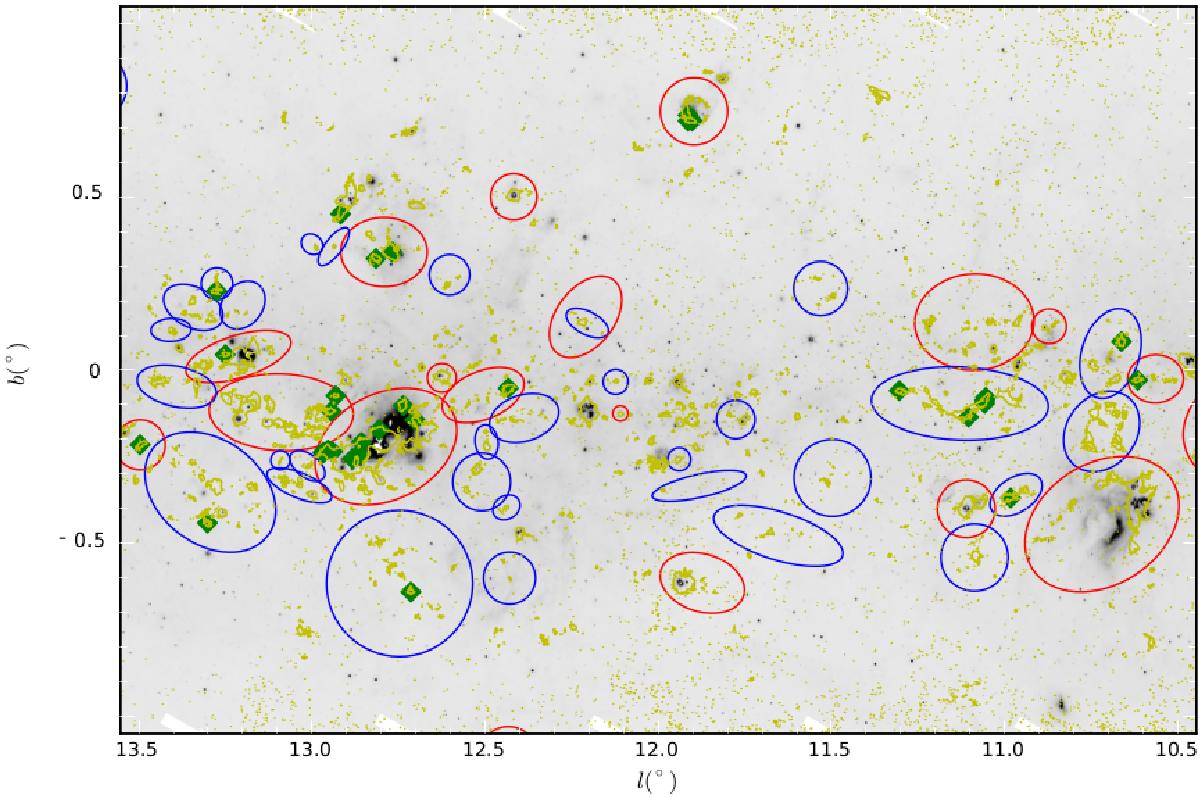
Greyscale MIPSGAL 24 μm map of the Galactic plane region comprised between Galactic longitudes l = 10.5−13.5deg. Overlayed yellow contours show 3σ level (0.15 Jy/beam) isocontours of ATLASGAL survey. Red circles and ellipses show our defined H ii regions while molecular cloud regions are shown in blue. Starless clumps are shown as green filled circles. In all cases, size of region markers matches their sizes.
Current usage metrics show cumulative count of Article Views (full-text article views including HTML views, PDF and ePub downloads, according to the available data) and Abstracts Views on Vision4Press platform.
Data correspond to usage on the plateform after 2015. The current usage metrics is available 48-96 hours after online publication and is updated daily on week days.
Initial download of the metrics may take a while.