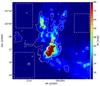
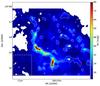
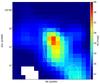
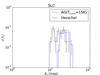
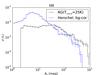
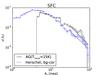
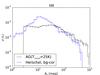
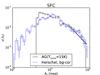
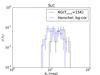
Fig. A.1
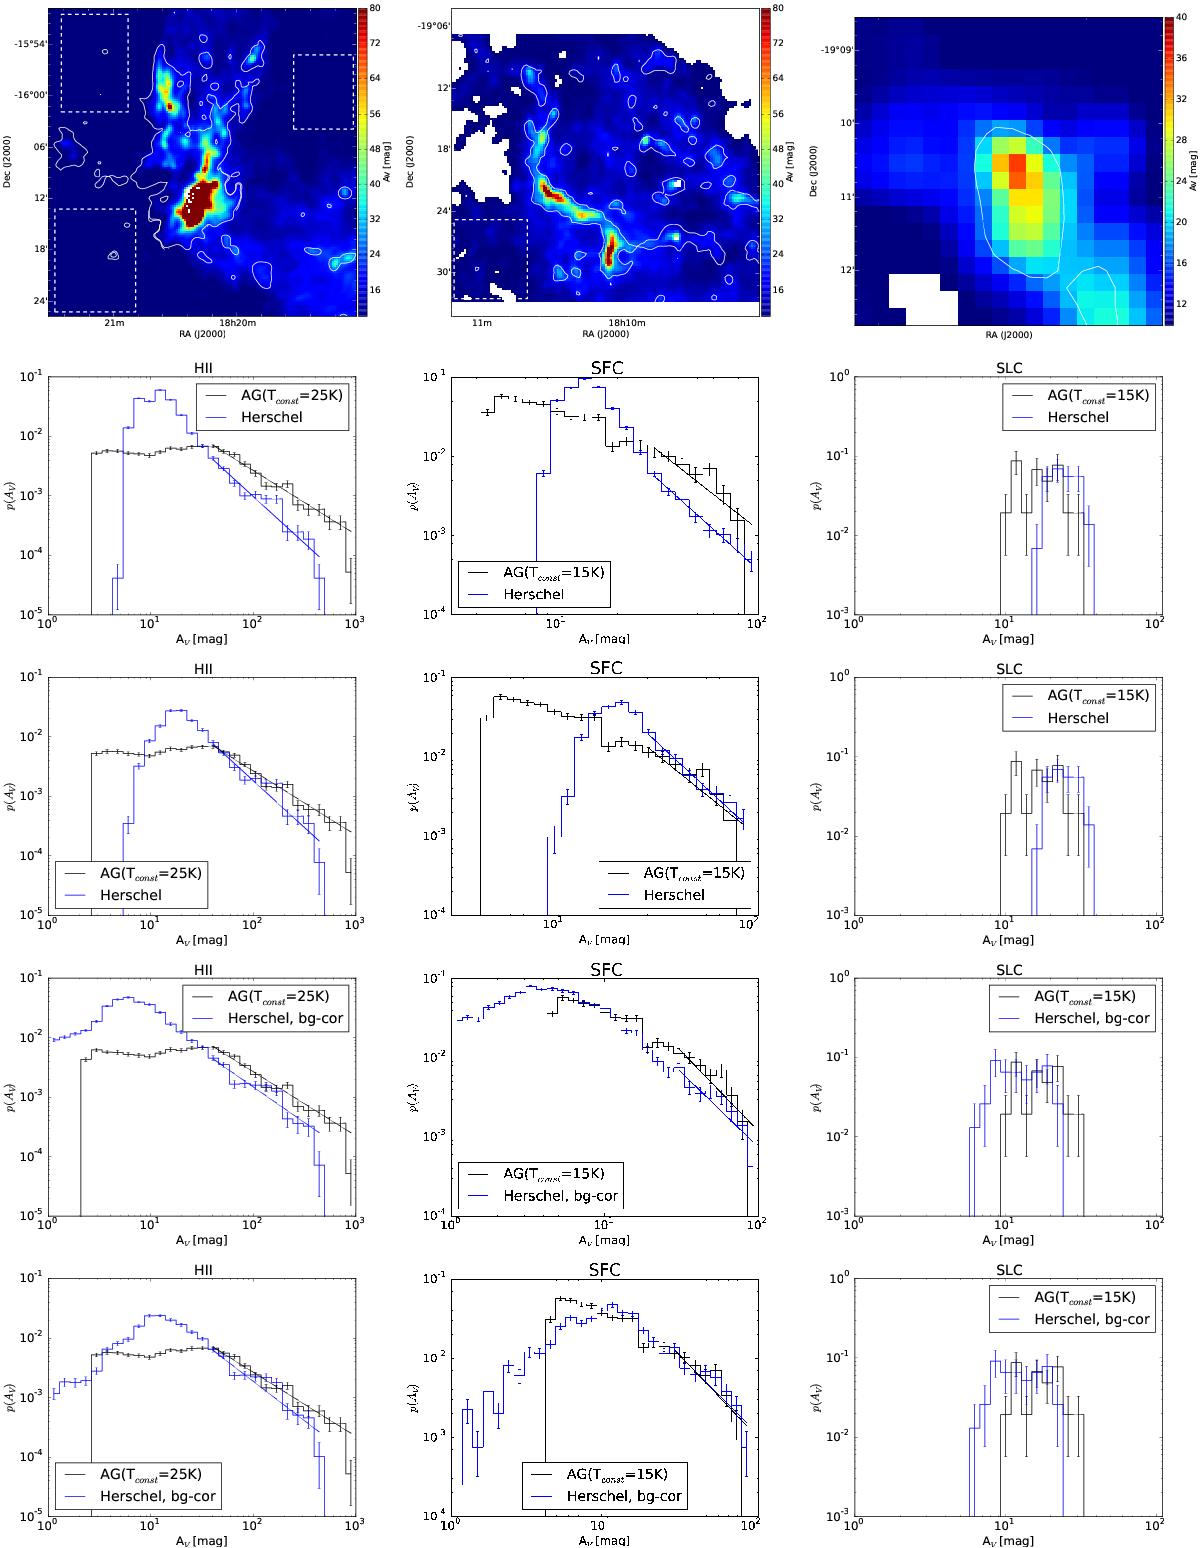
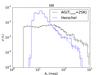
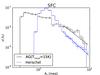
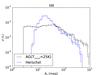
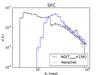
Top row: Herschel-derived column density maps of M17 (H ii region), G11 (SFC) and #53c (SLC), in units of AV. The white contours show the dense gas area (AV> 2 mag, 4.5 mag and 9 mag for the H ii region, SFC and SLC respectively). The white dashed boxes show the regions where the background contamination of Herschel has been calculated. Second row: N-PDFs as seen by Herschel (blue) and ATLASGAL (black) in the maps shown in the top row. The vertical error bars show the Poison standard deviation. The solid lines show the best fit to the power-law tail. Third row: ATLASGAL-derived and Herschel-derived N-PDFs in the dense gas area. Fourth row: background corrected ATLASGAL-derived and Herschel-derived N-PDFs in the whole map area of the top row. The background emission was estimated as the mean column density in the dashed boxes of the first row, seen by Herschel. Bottom row: background corrected N-PDFs evaluated in the dense gas area.


Current usage metrics show cumulative count of Article Views (full-text article views including HTML views, PDF and ePub downloads, according to the available data) and Abstracts Views on Vision4Press platform.
Data correspond to usage on the plateform after 2015. The current usage metrics is available 48-96 hours after online publication and is updated daily on week days.
Initial download of the metrics may take a while.