Free Access
Fig. 10
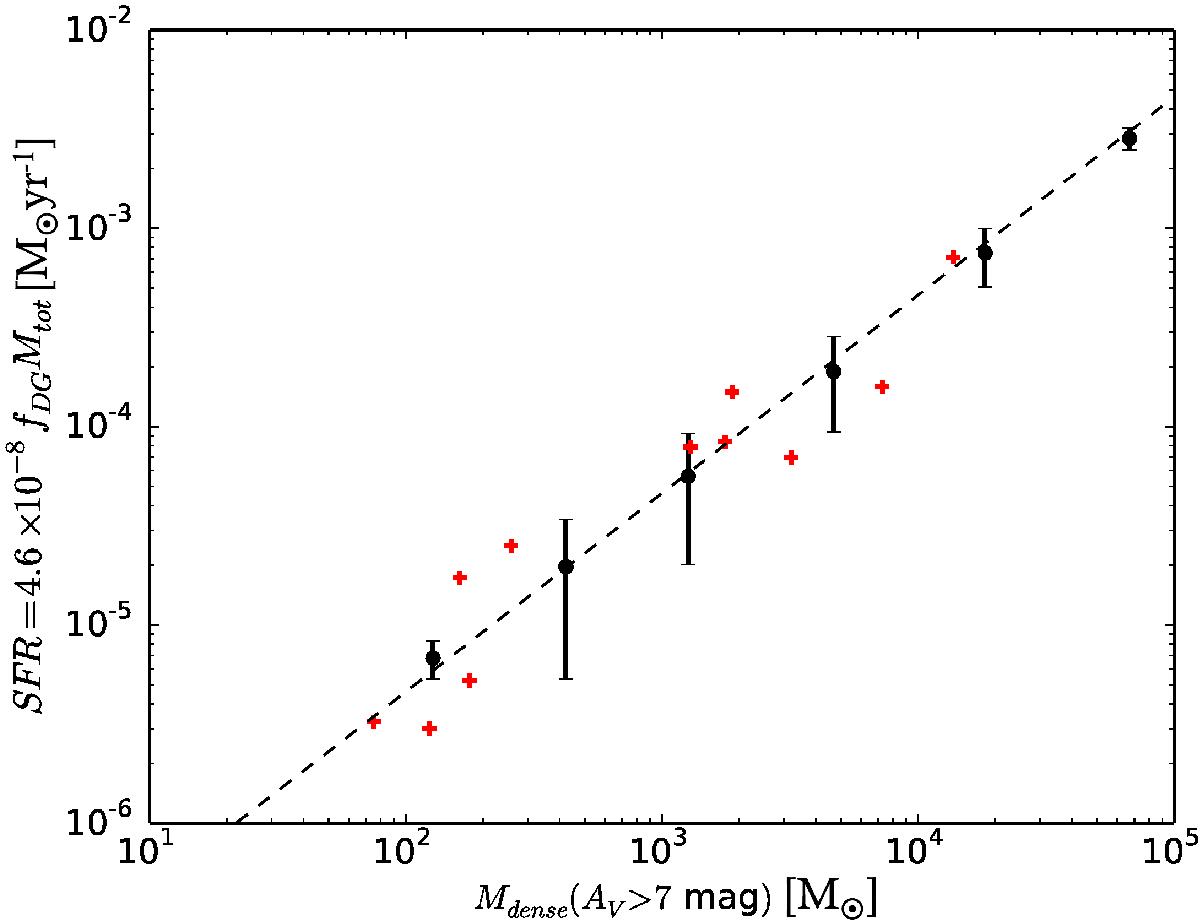
SFR as defined in Lada et al. (2012) for different mass ranges of SFCs and H ii regions. Red crosses show data from Lada et al. (2012). Solid black vertical lines show the standard deviation, σ, for each mass bin for our study. Black dashed line shows the constant value fDG = 1.
Current usage metrics show cumulative count of Article Views (full-text article views including HTML views, PDF and ePub downloads, according to the available data) and Abstracts Views on Vision4Press platform.
Data correspond to usage on the plateform after 2015. The current usage metrics is available 48-96 hours after online publication and is updated daily on week days.
Initial download of the metrics may take a while.