Fig. 1
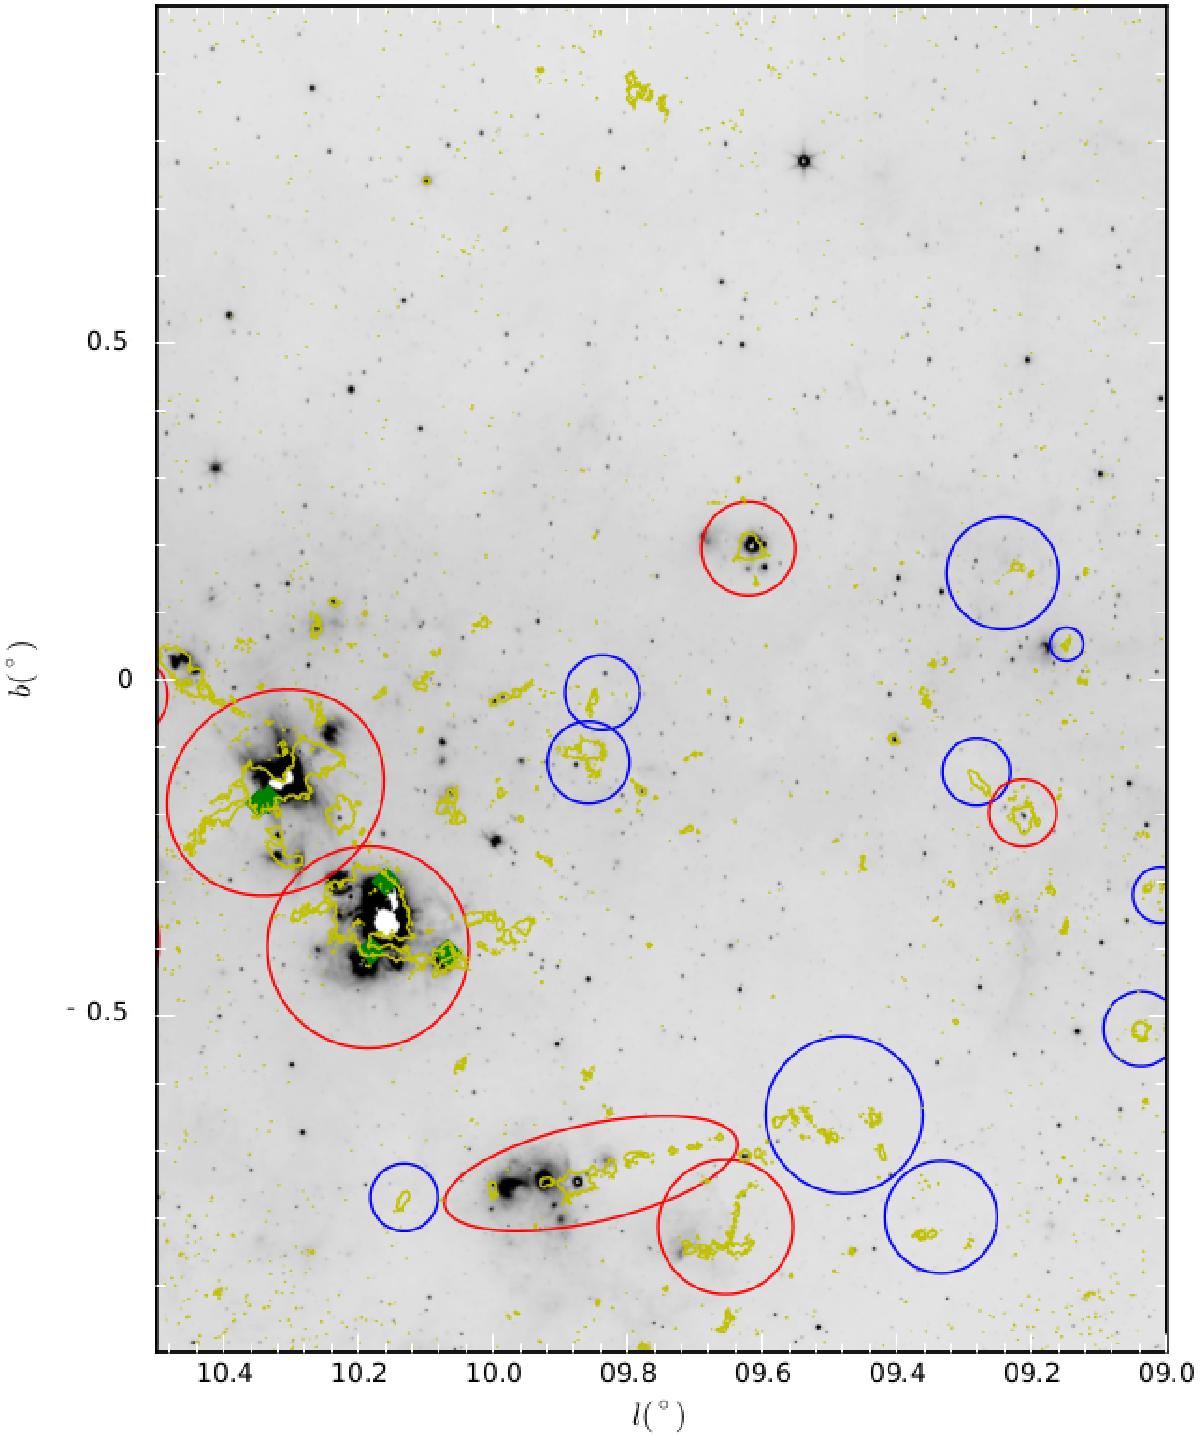
MIPSGAL 24 μm map of the Galactic plane between 9deg <l< 10.5deg. Yellow contours indicate the 3σ (0.15 Jy/beam) emission level of the ATLASGAL data. Red and blue ellipses show the H ii regions and SFCs, respectively. SLCs are shown with green filled diamonds. Similar maps for the Galactic plane between 10.5deg <l< 21deg and | b | ≤ 1deg are shown in Appendix C.
Current usage metrics show cumulative count of Article Views (full-text article views including HTML views, PDF and ePub downloads, according to the available data) and Abstracts Views on Vision4Press platform.
Data correspond to usage on the plateform after 2015. The current usage metrics is available 48-96 hours after online publication and is updated daily on week days.
Initial download of the metrics may take a while.