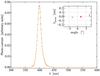
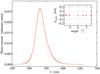
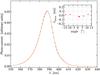
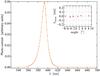
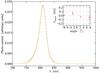
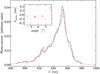
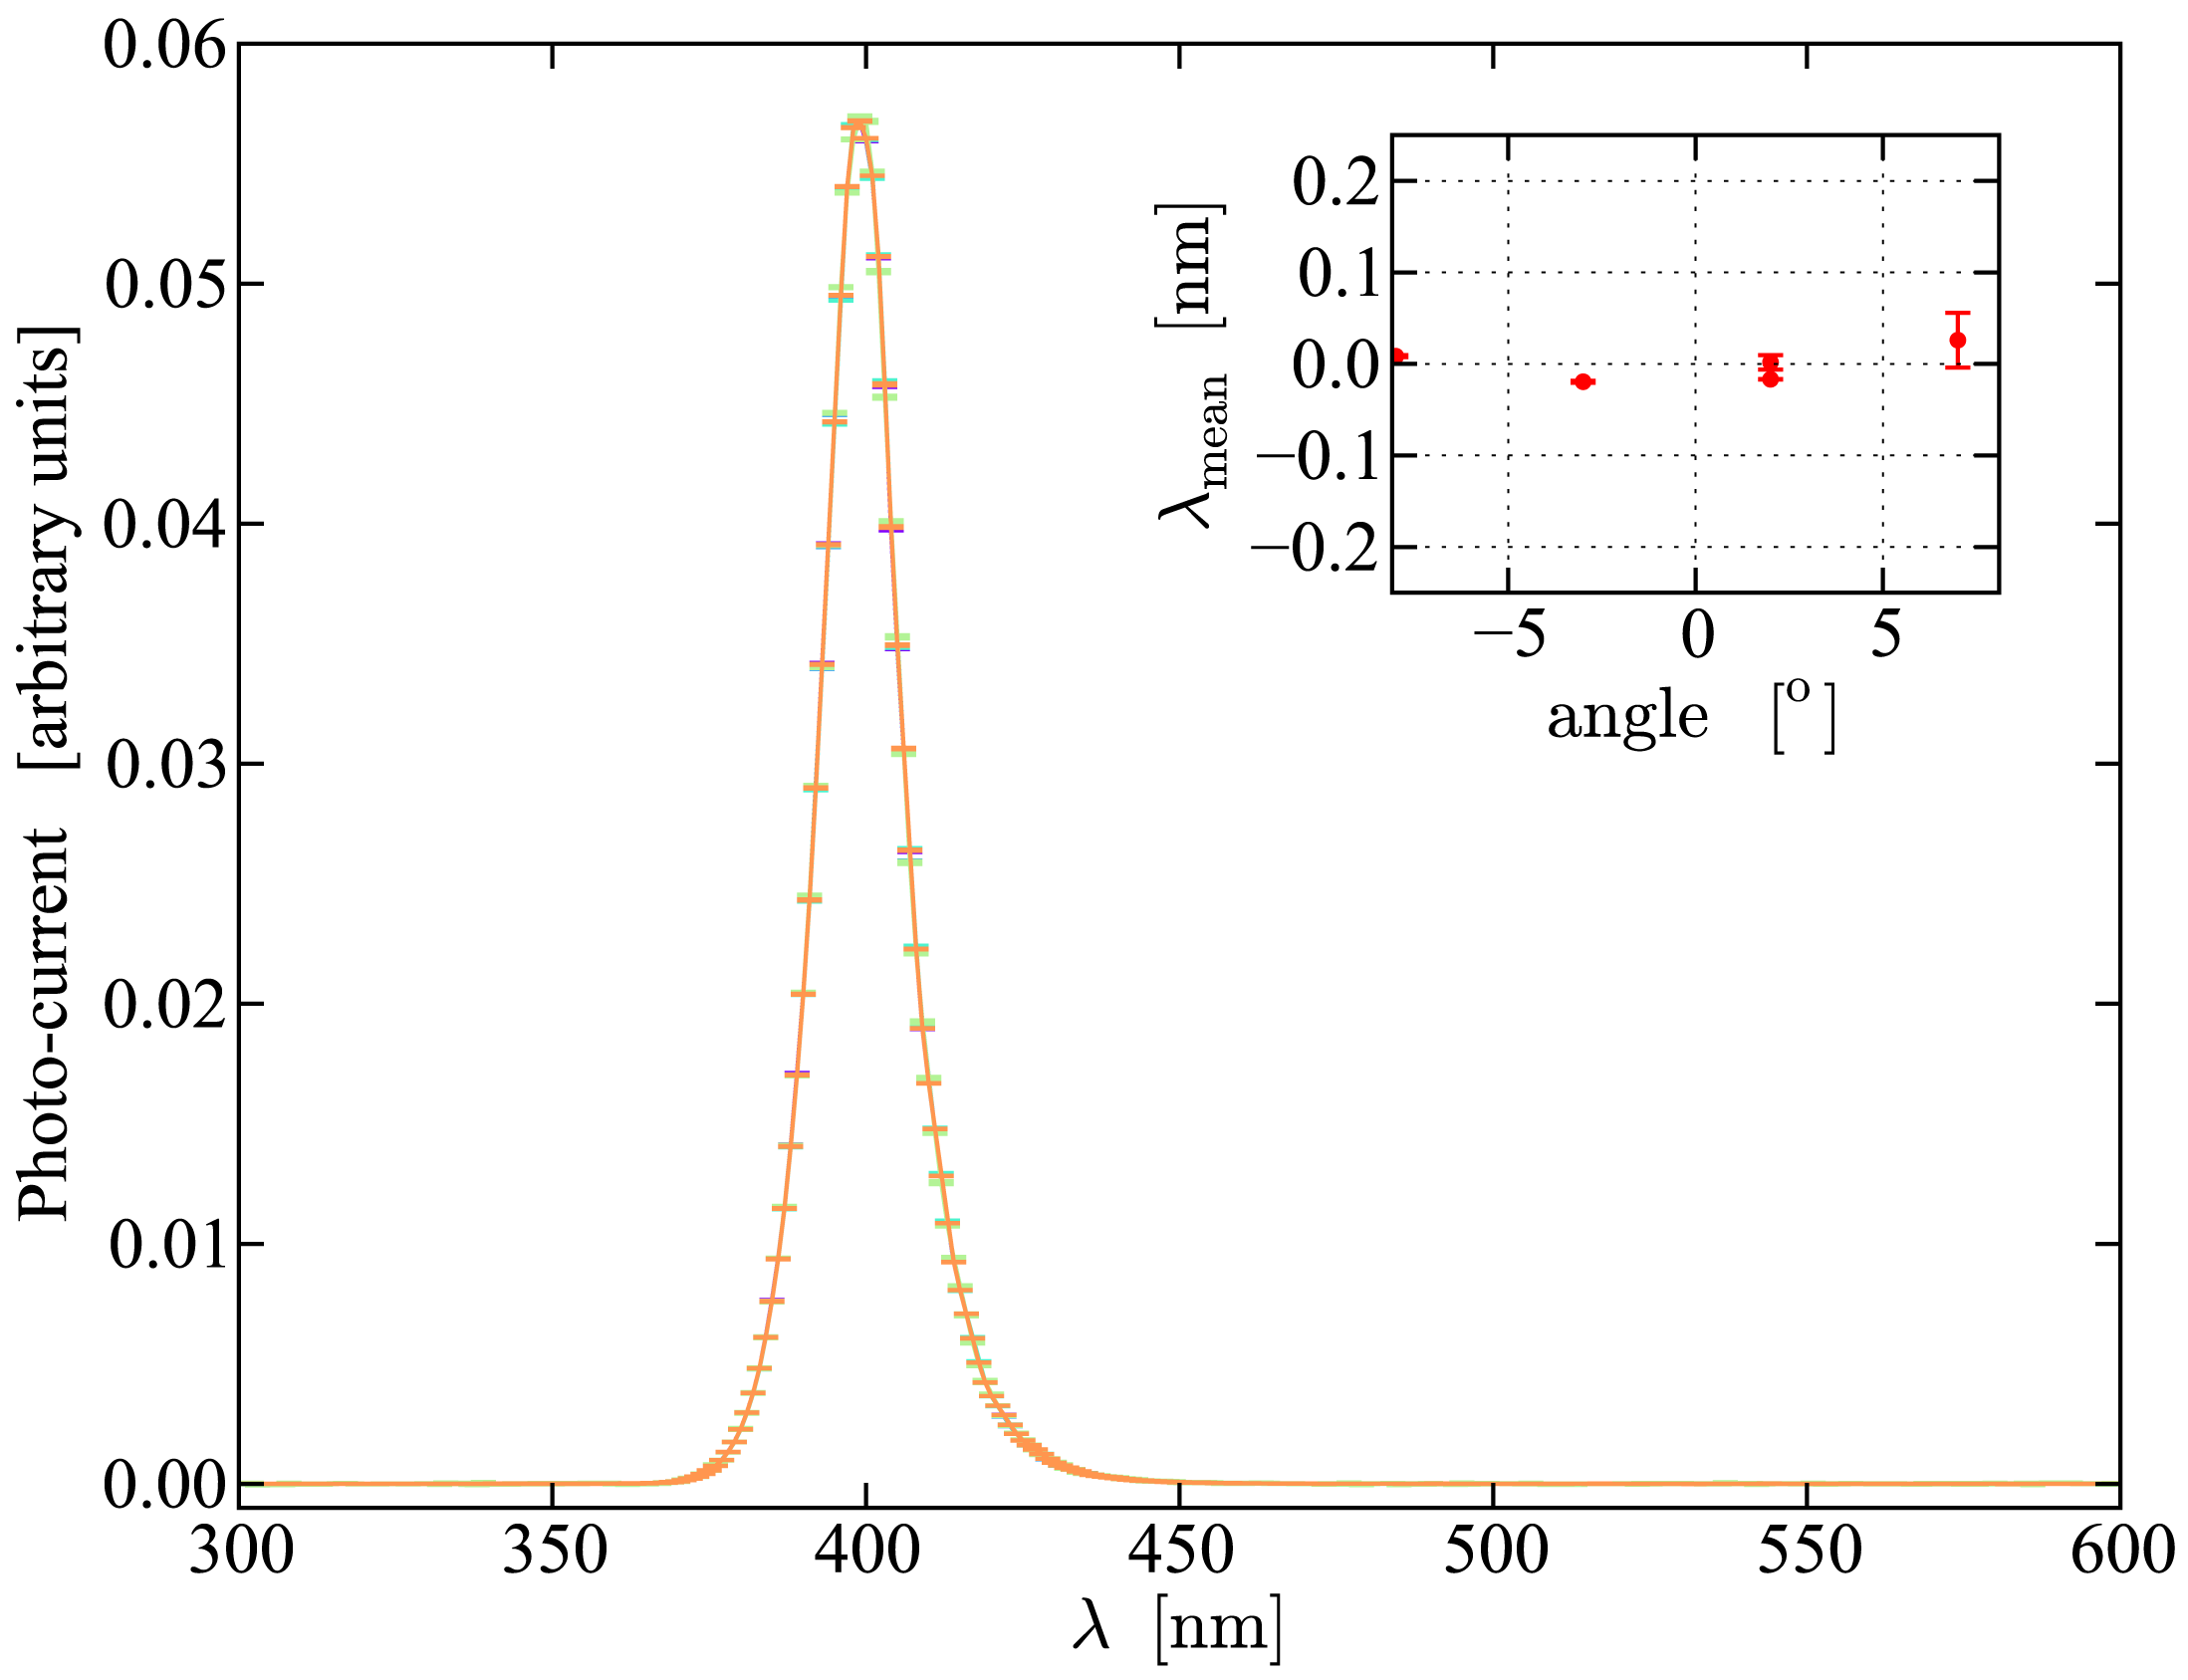
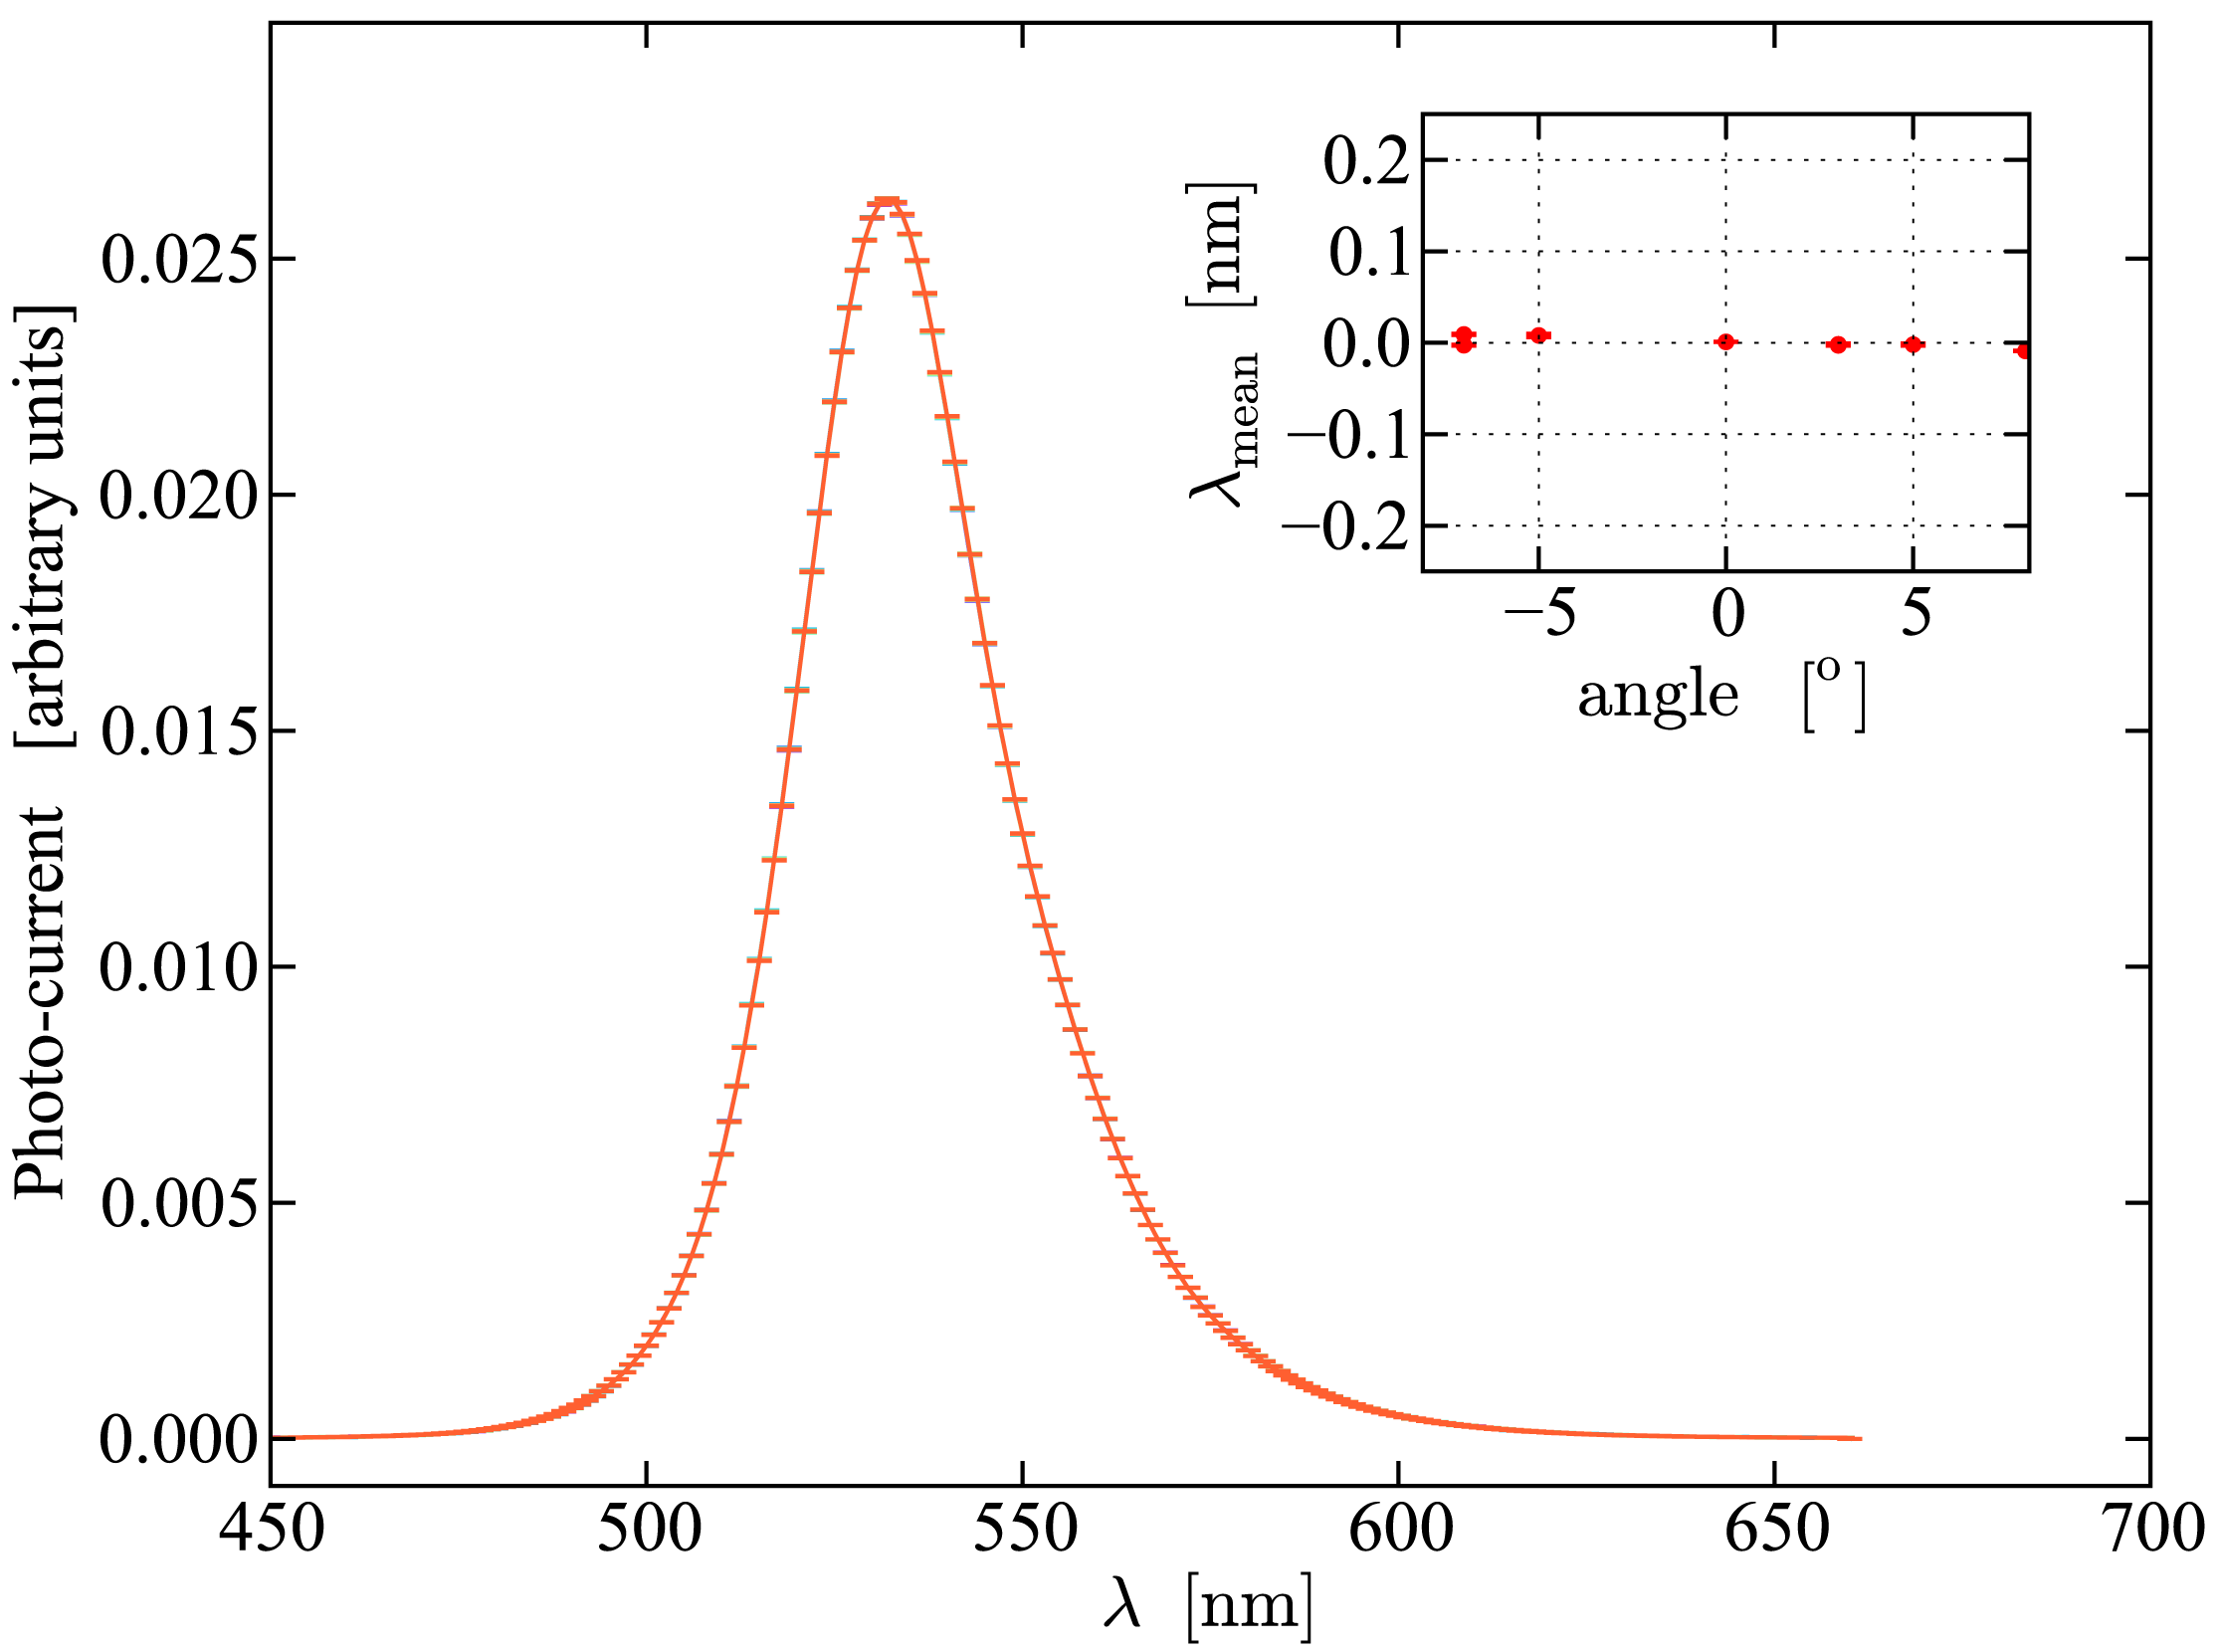
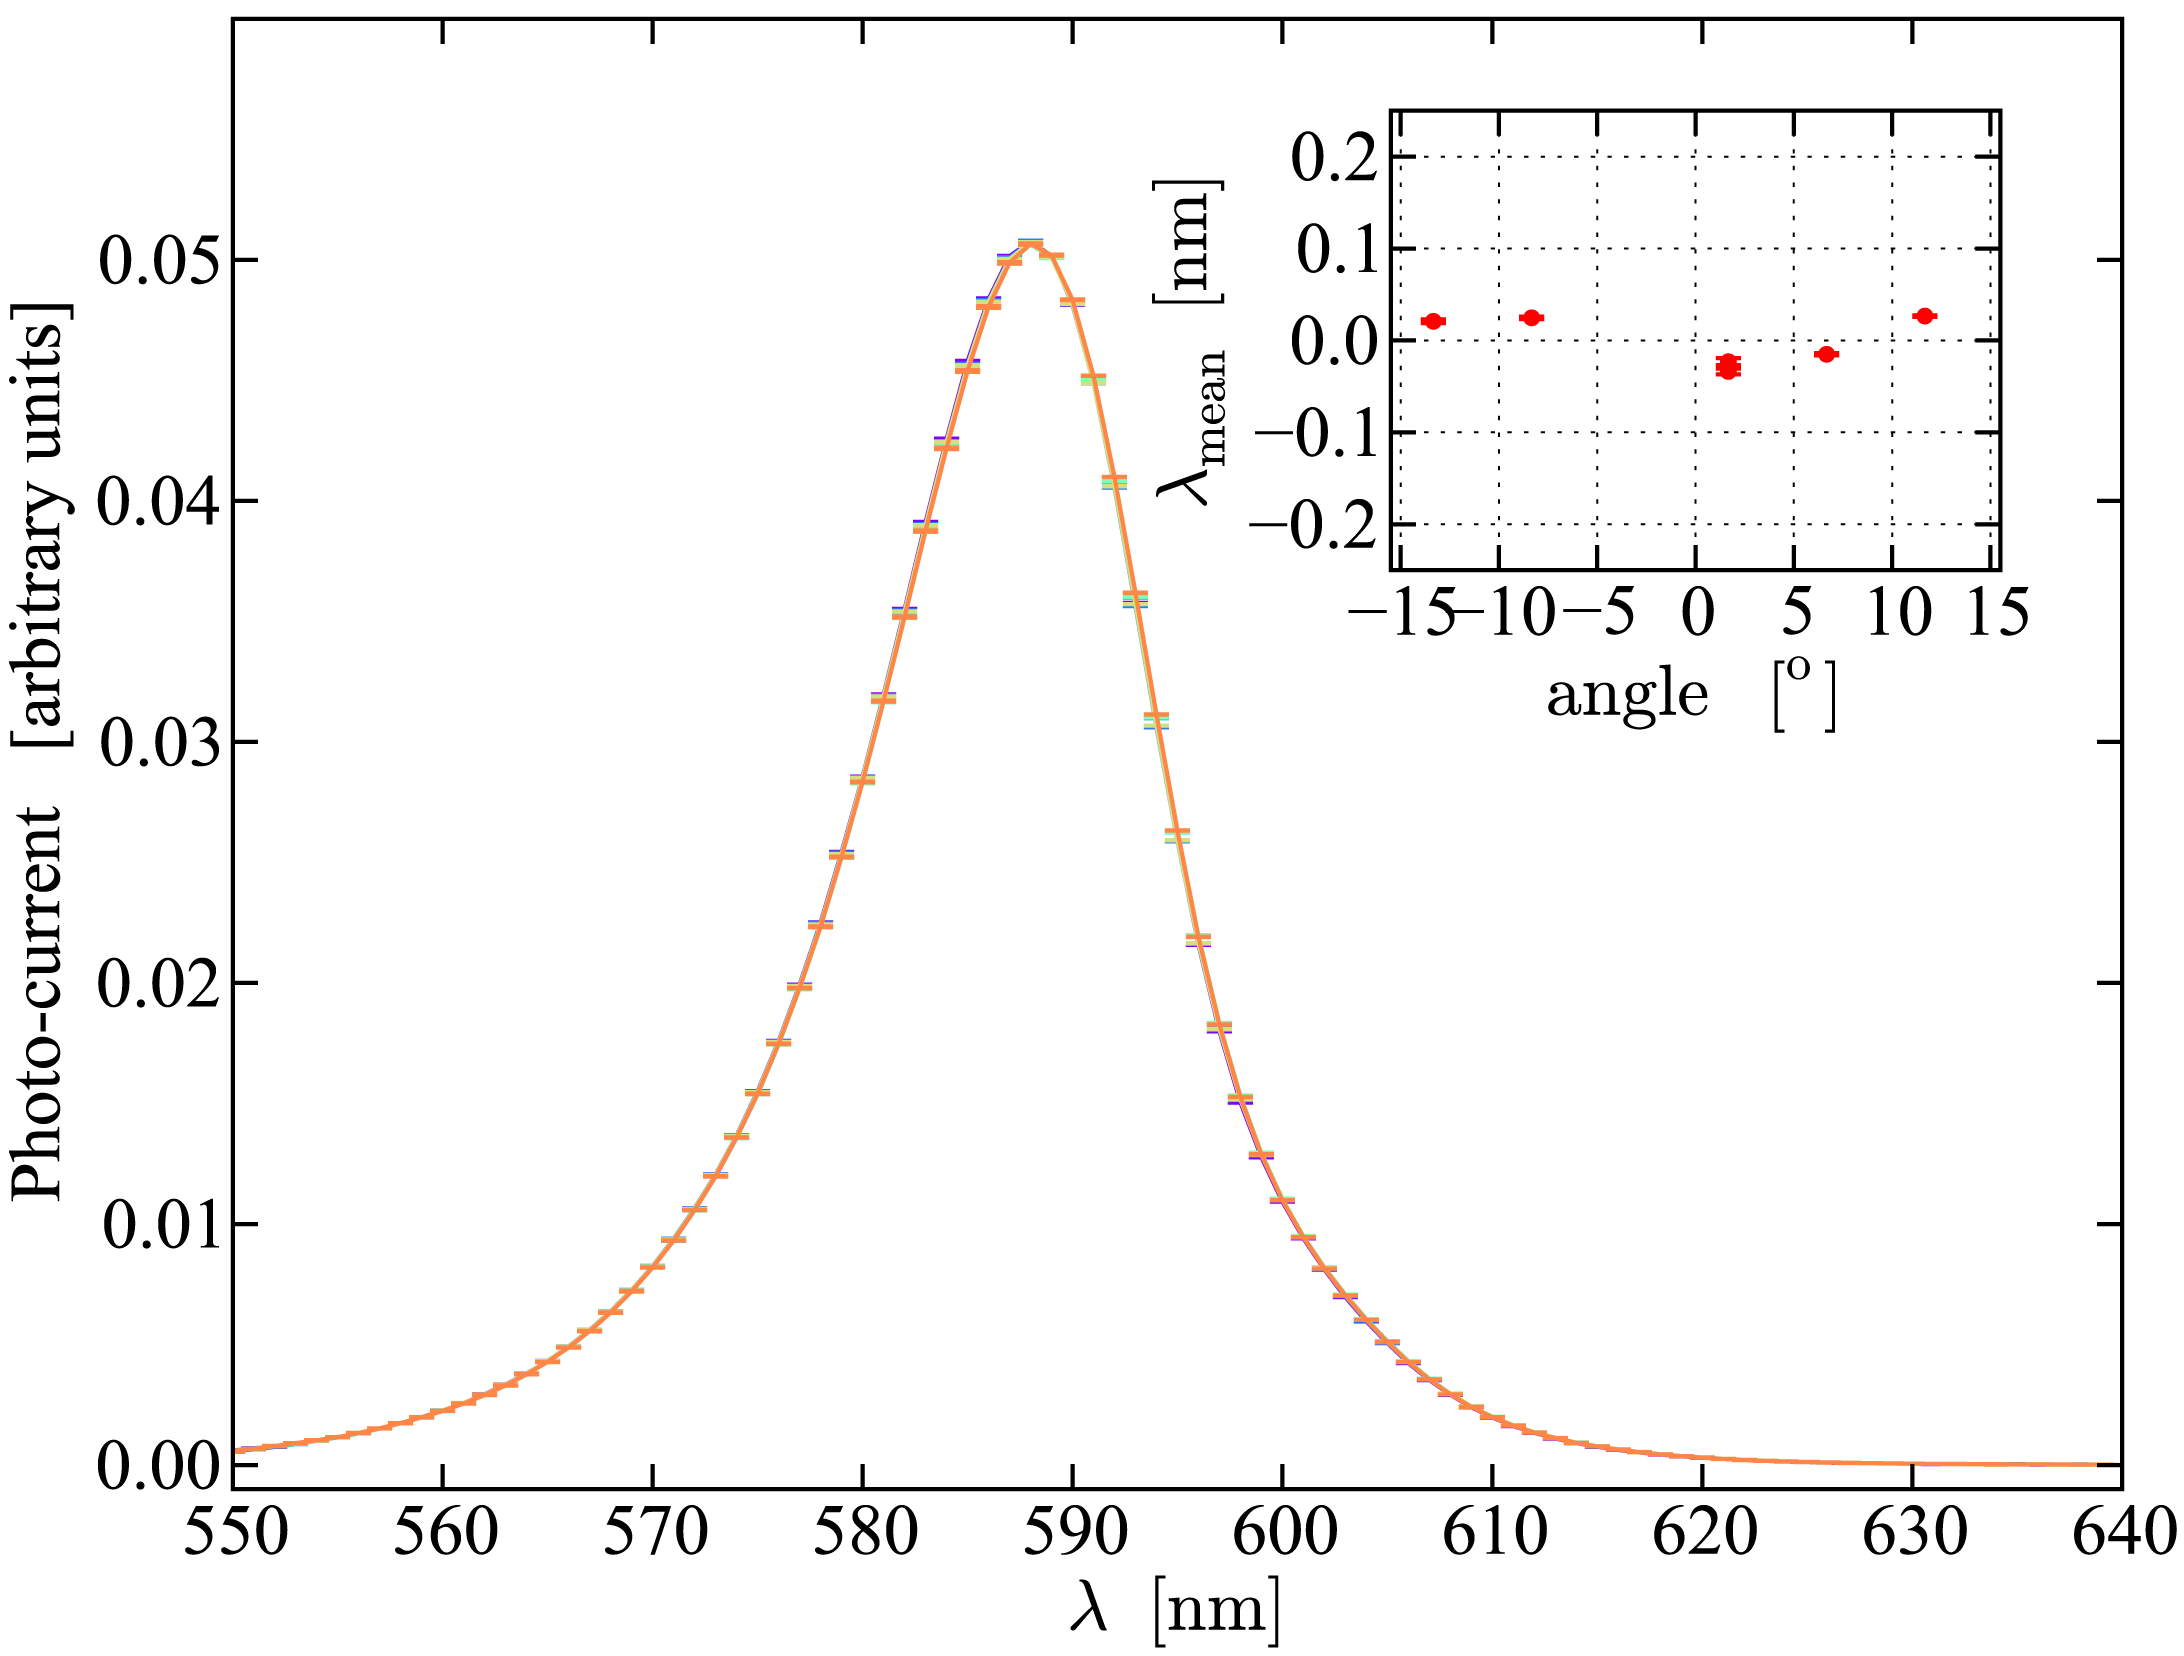
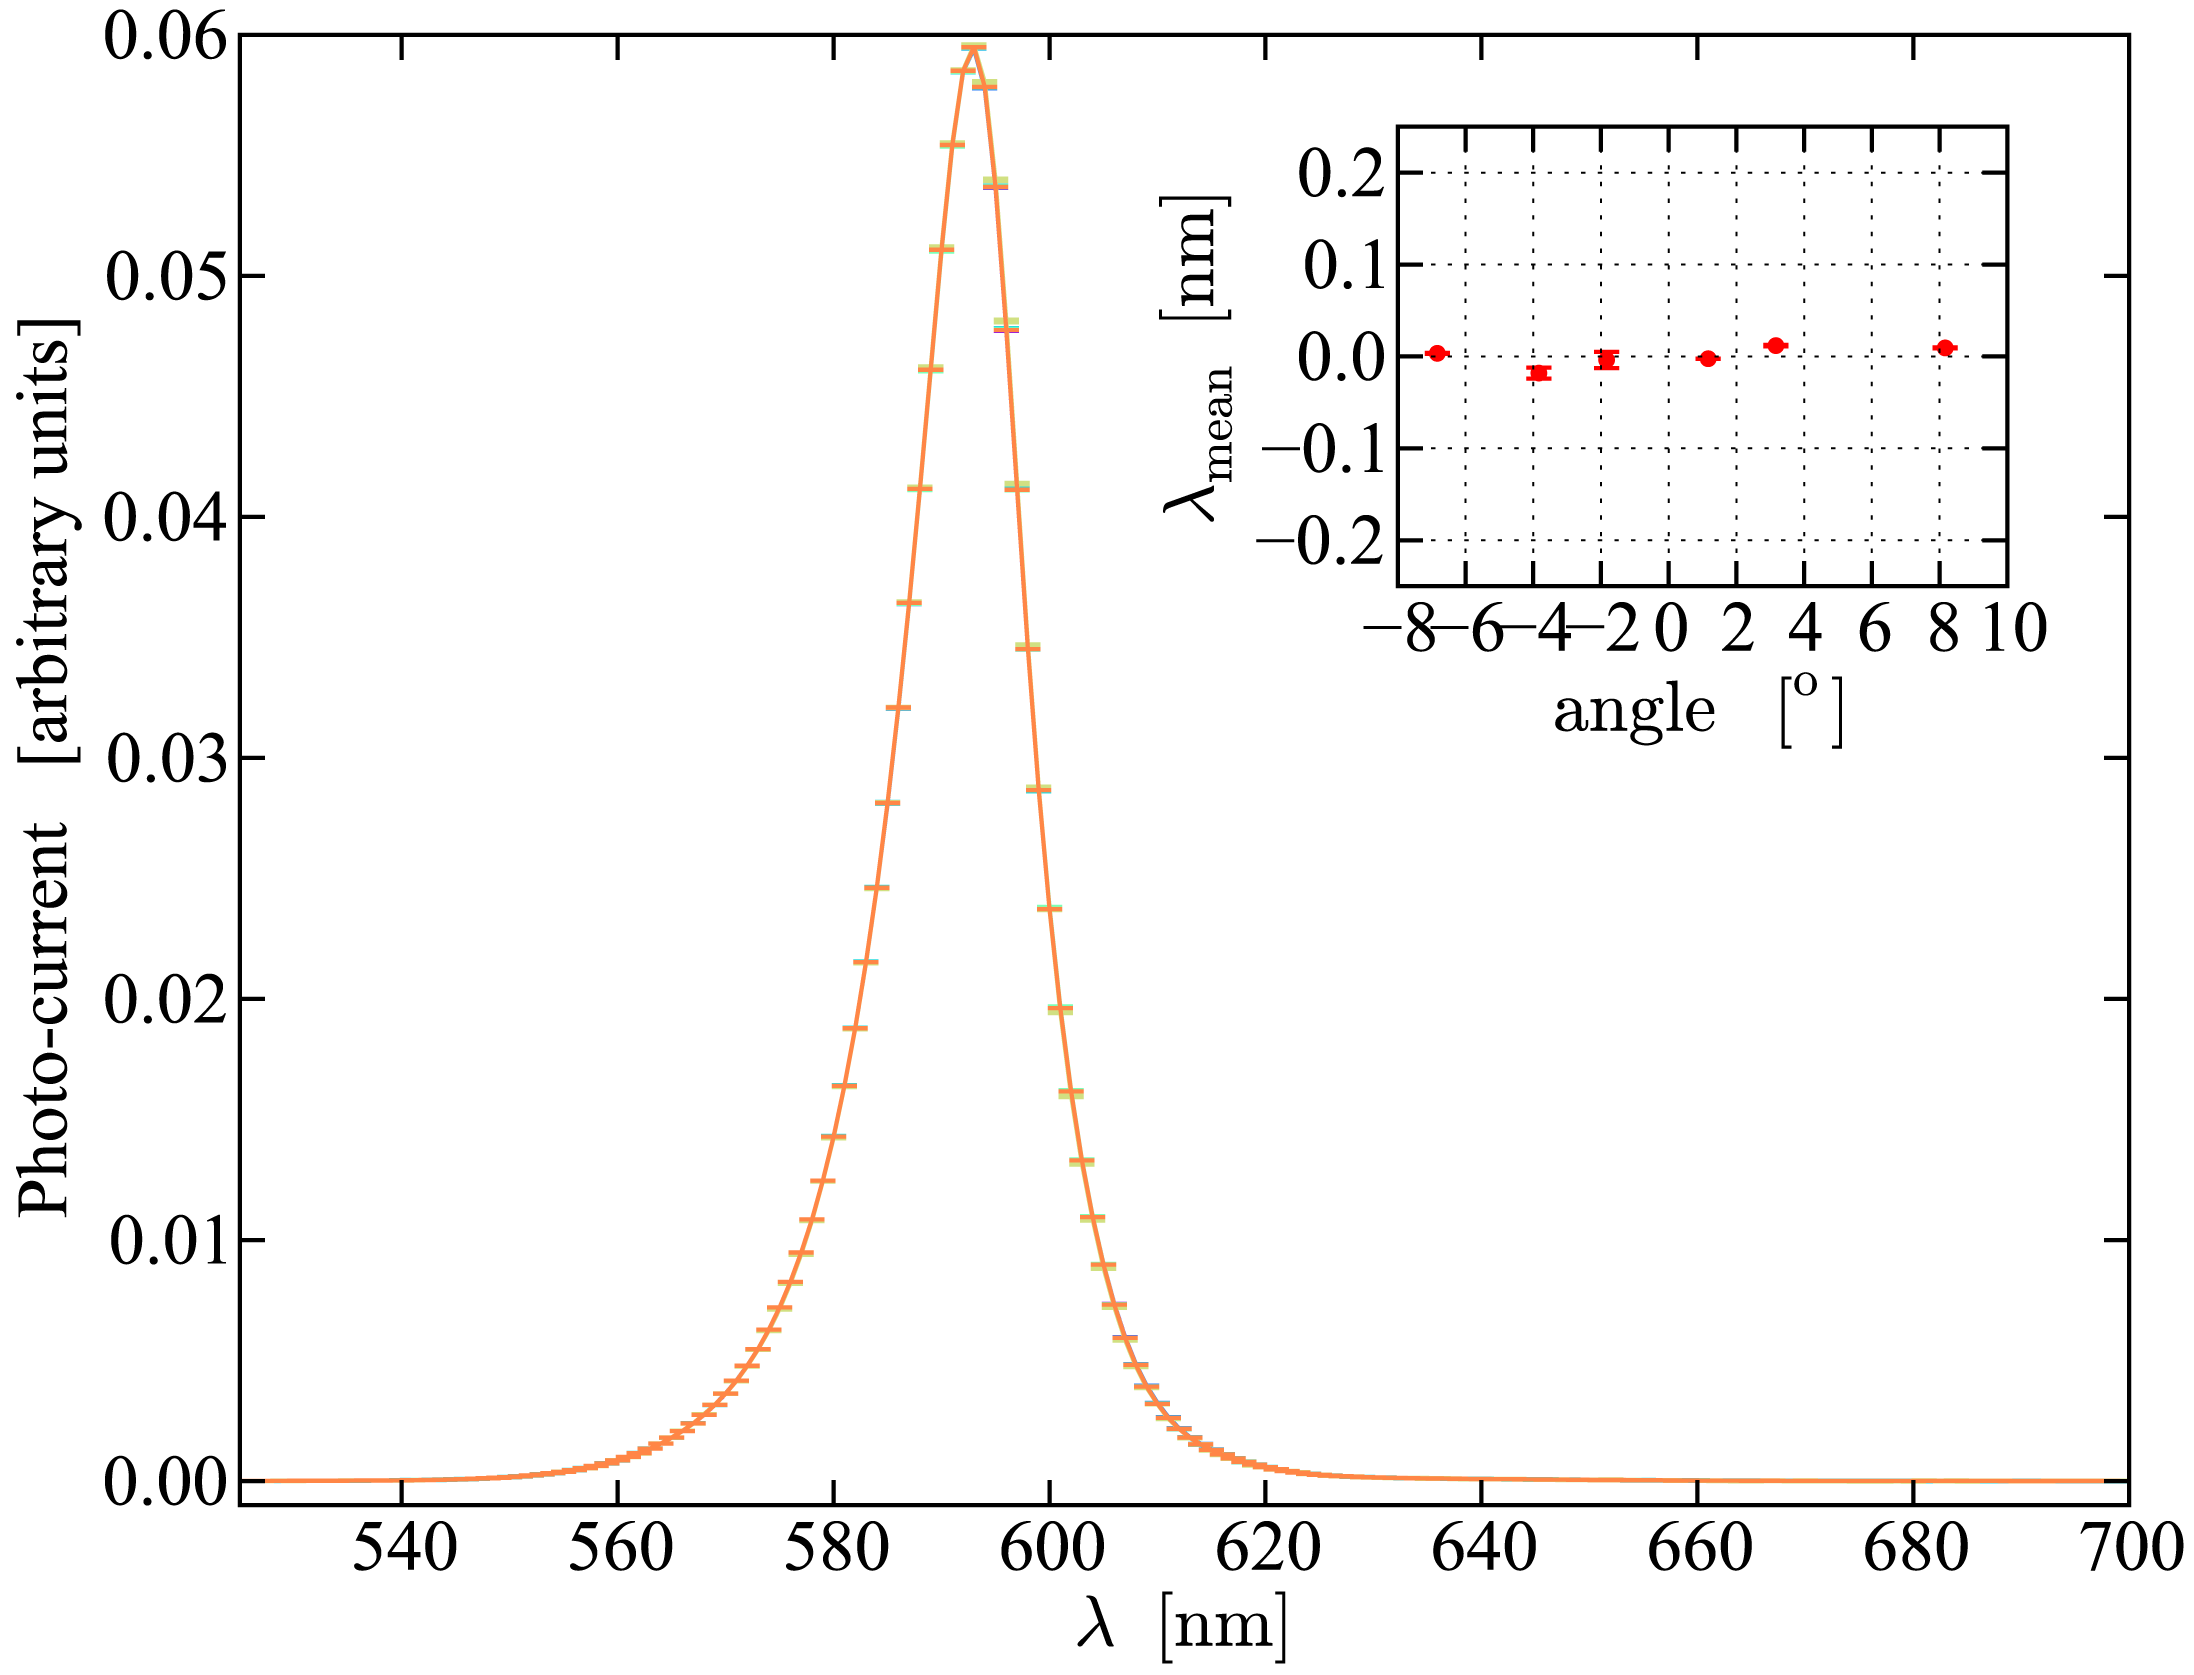
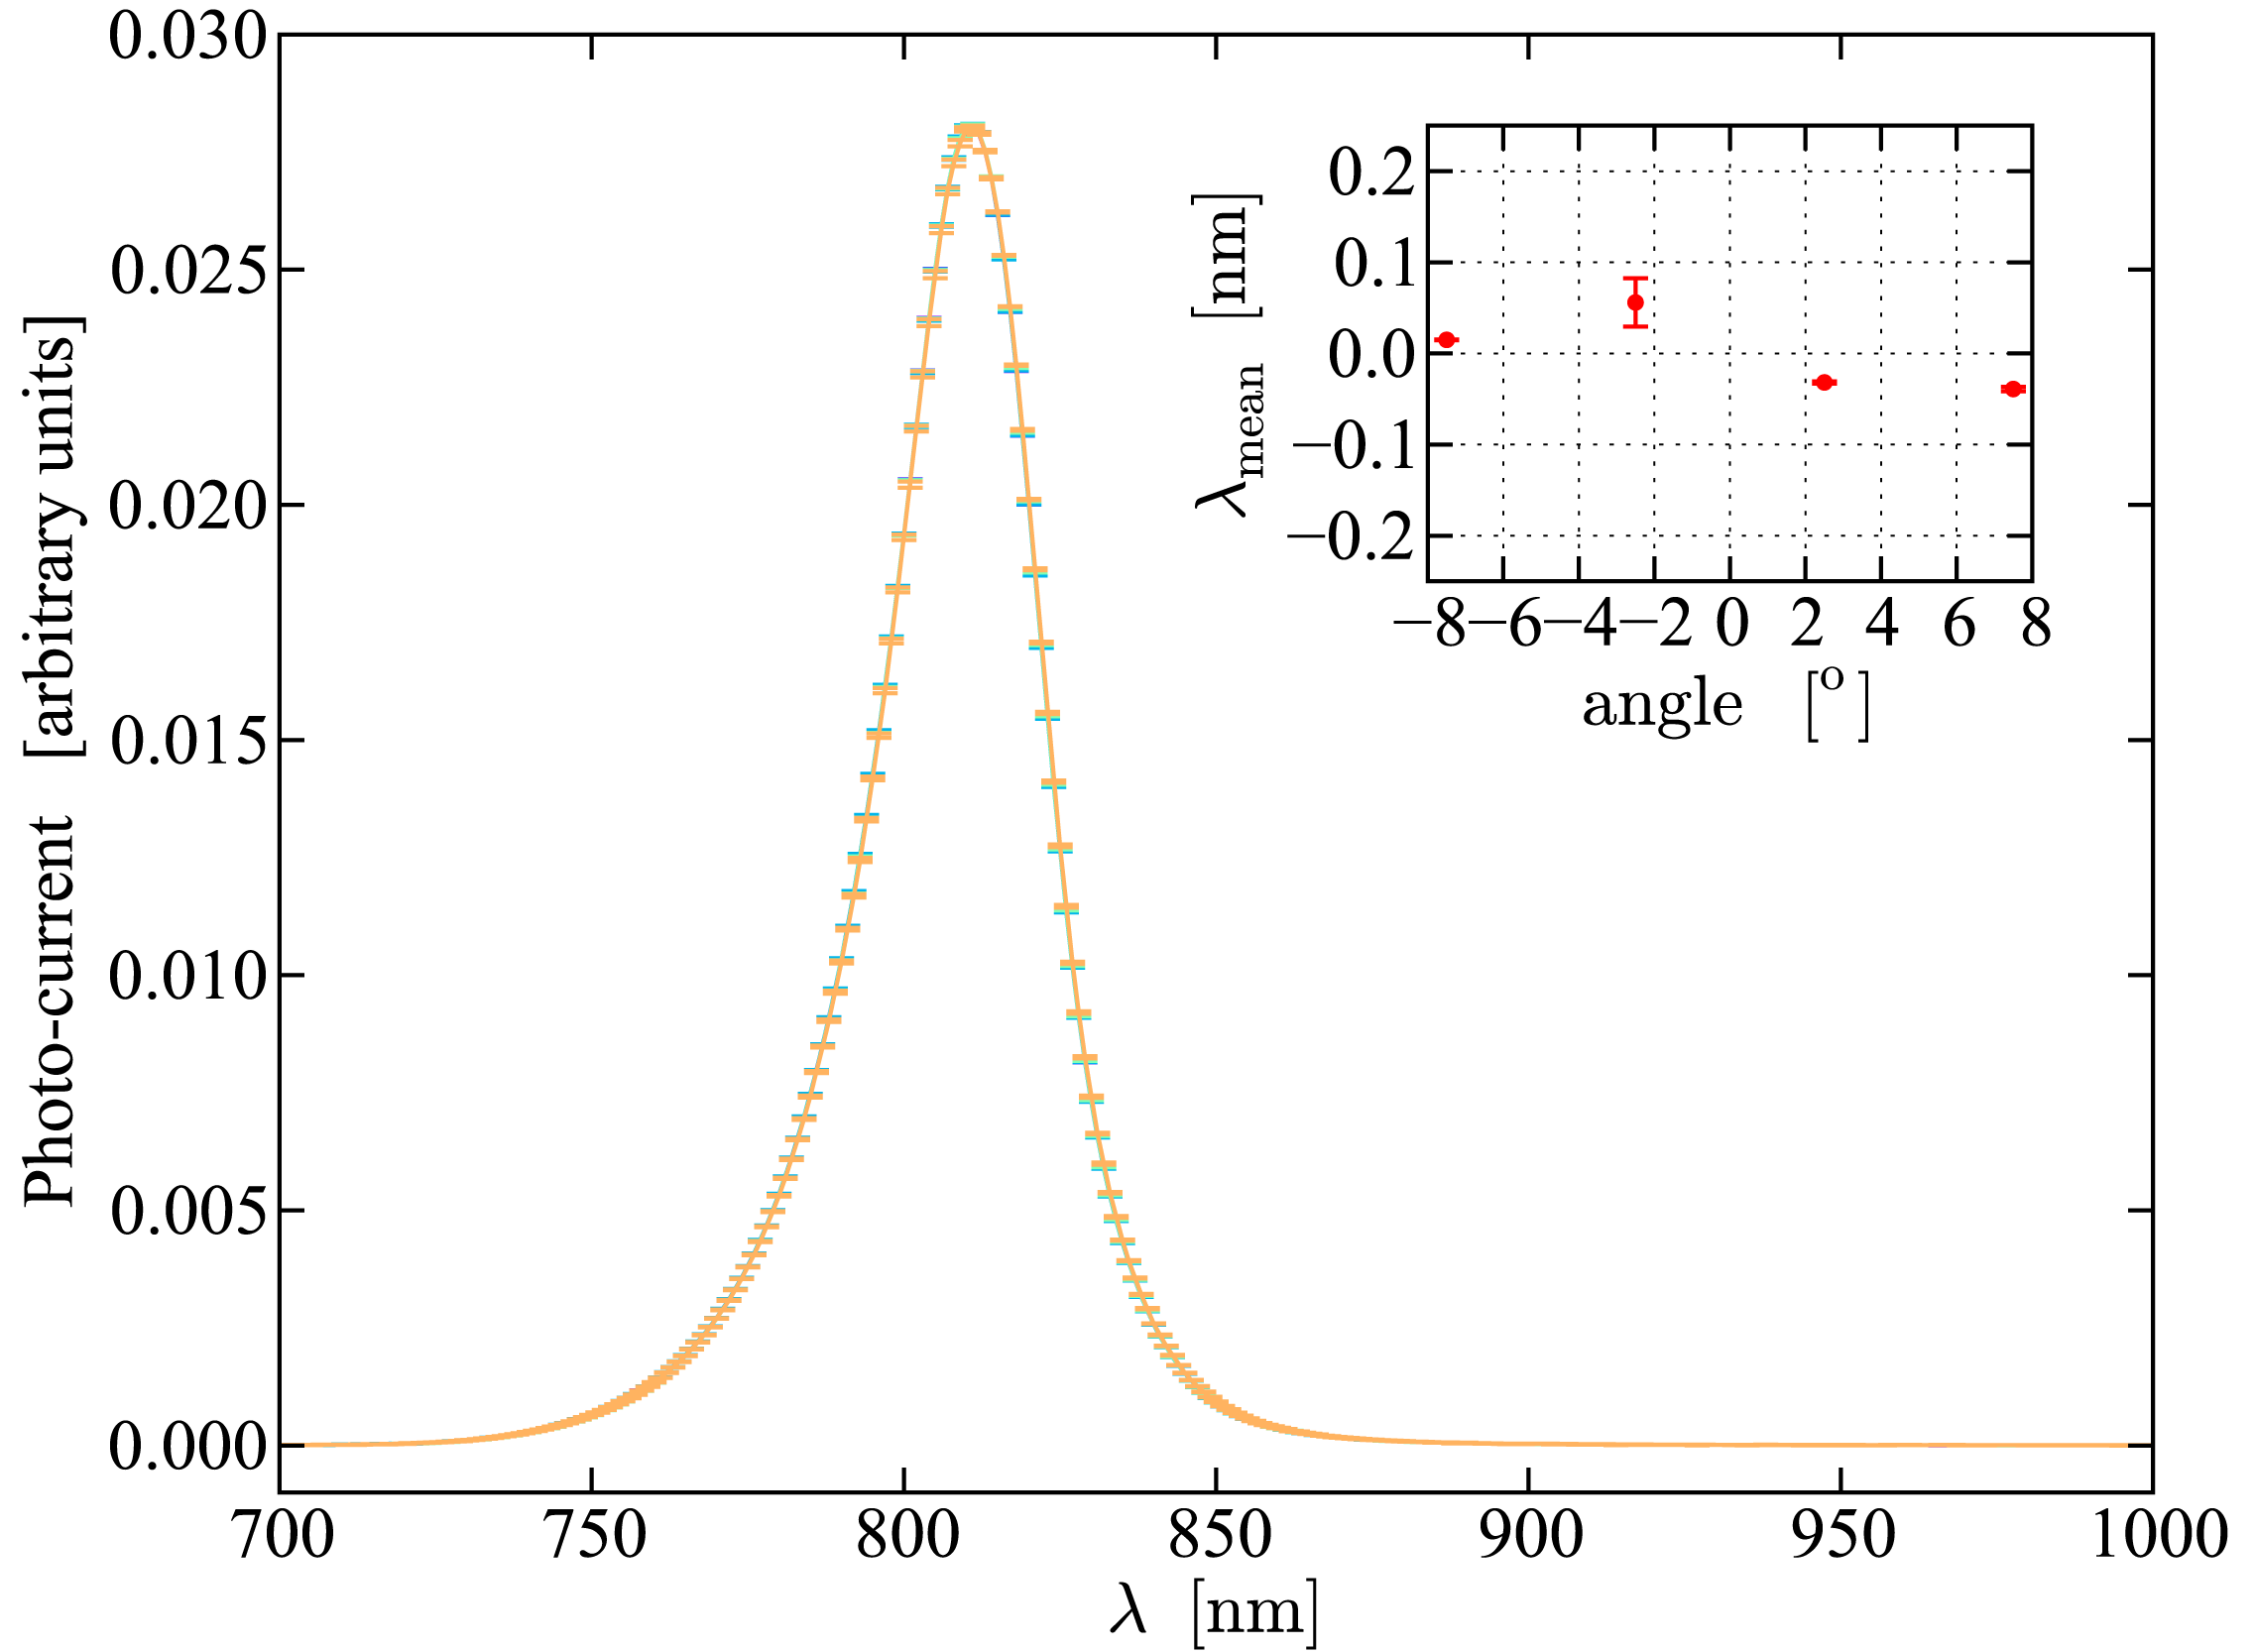
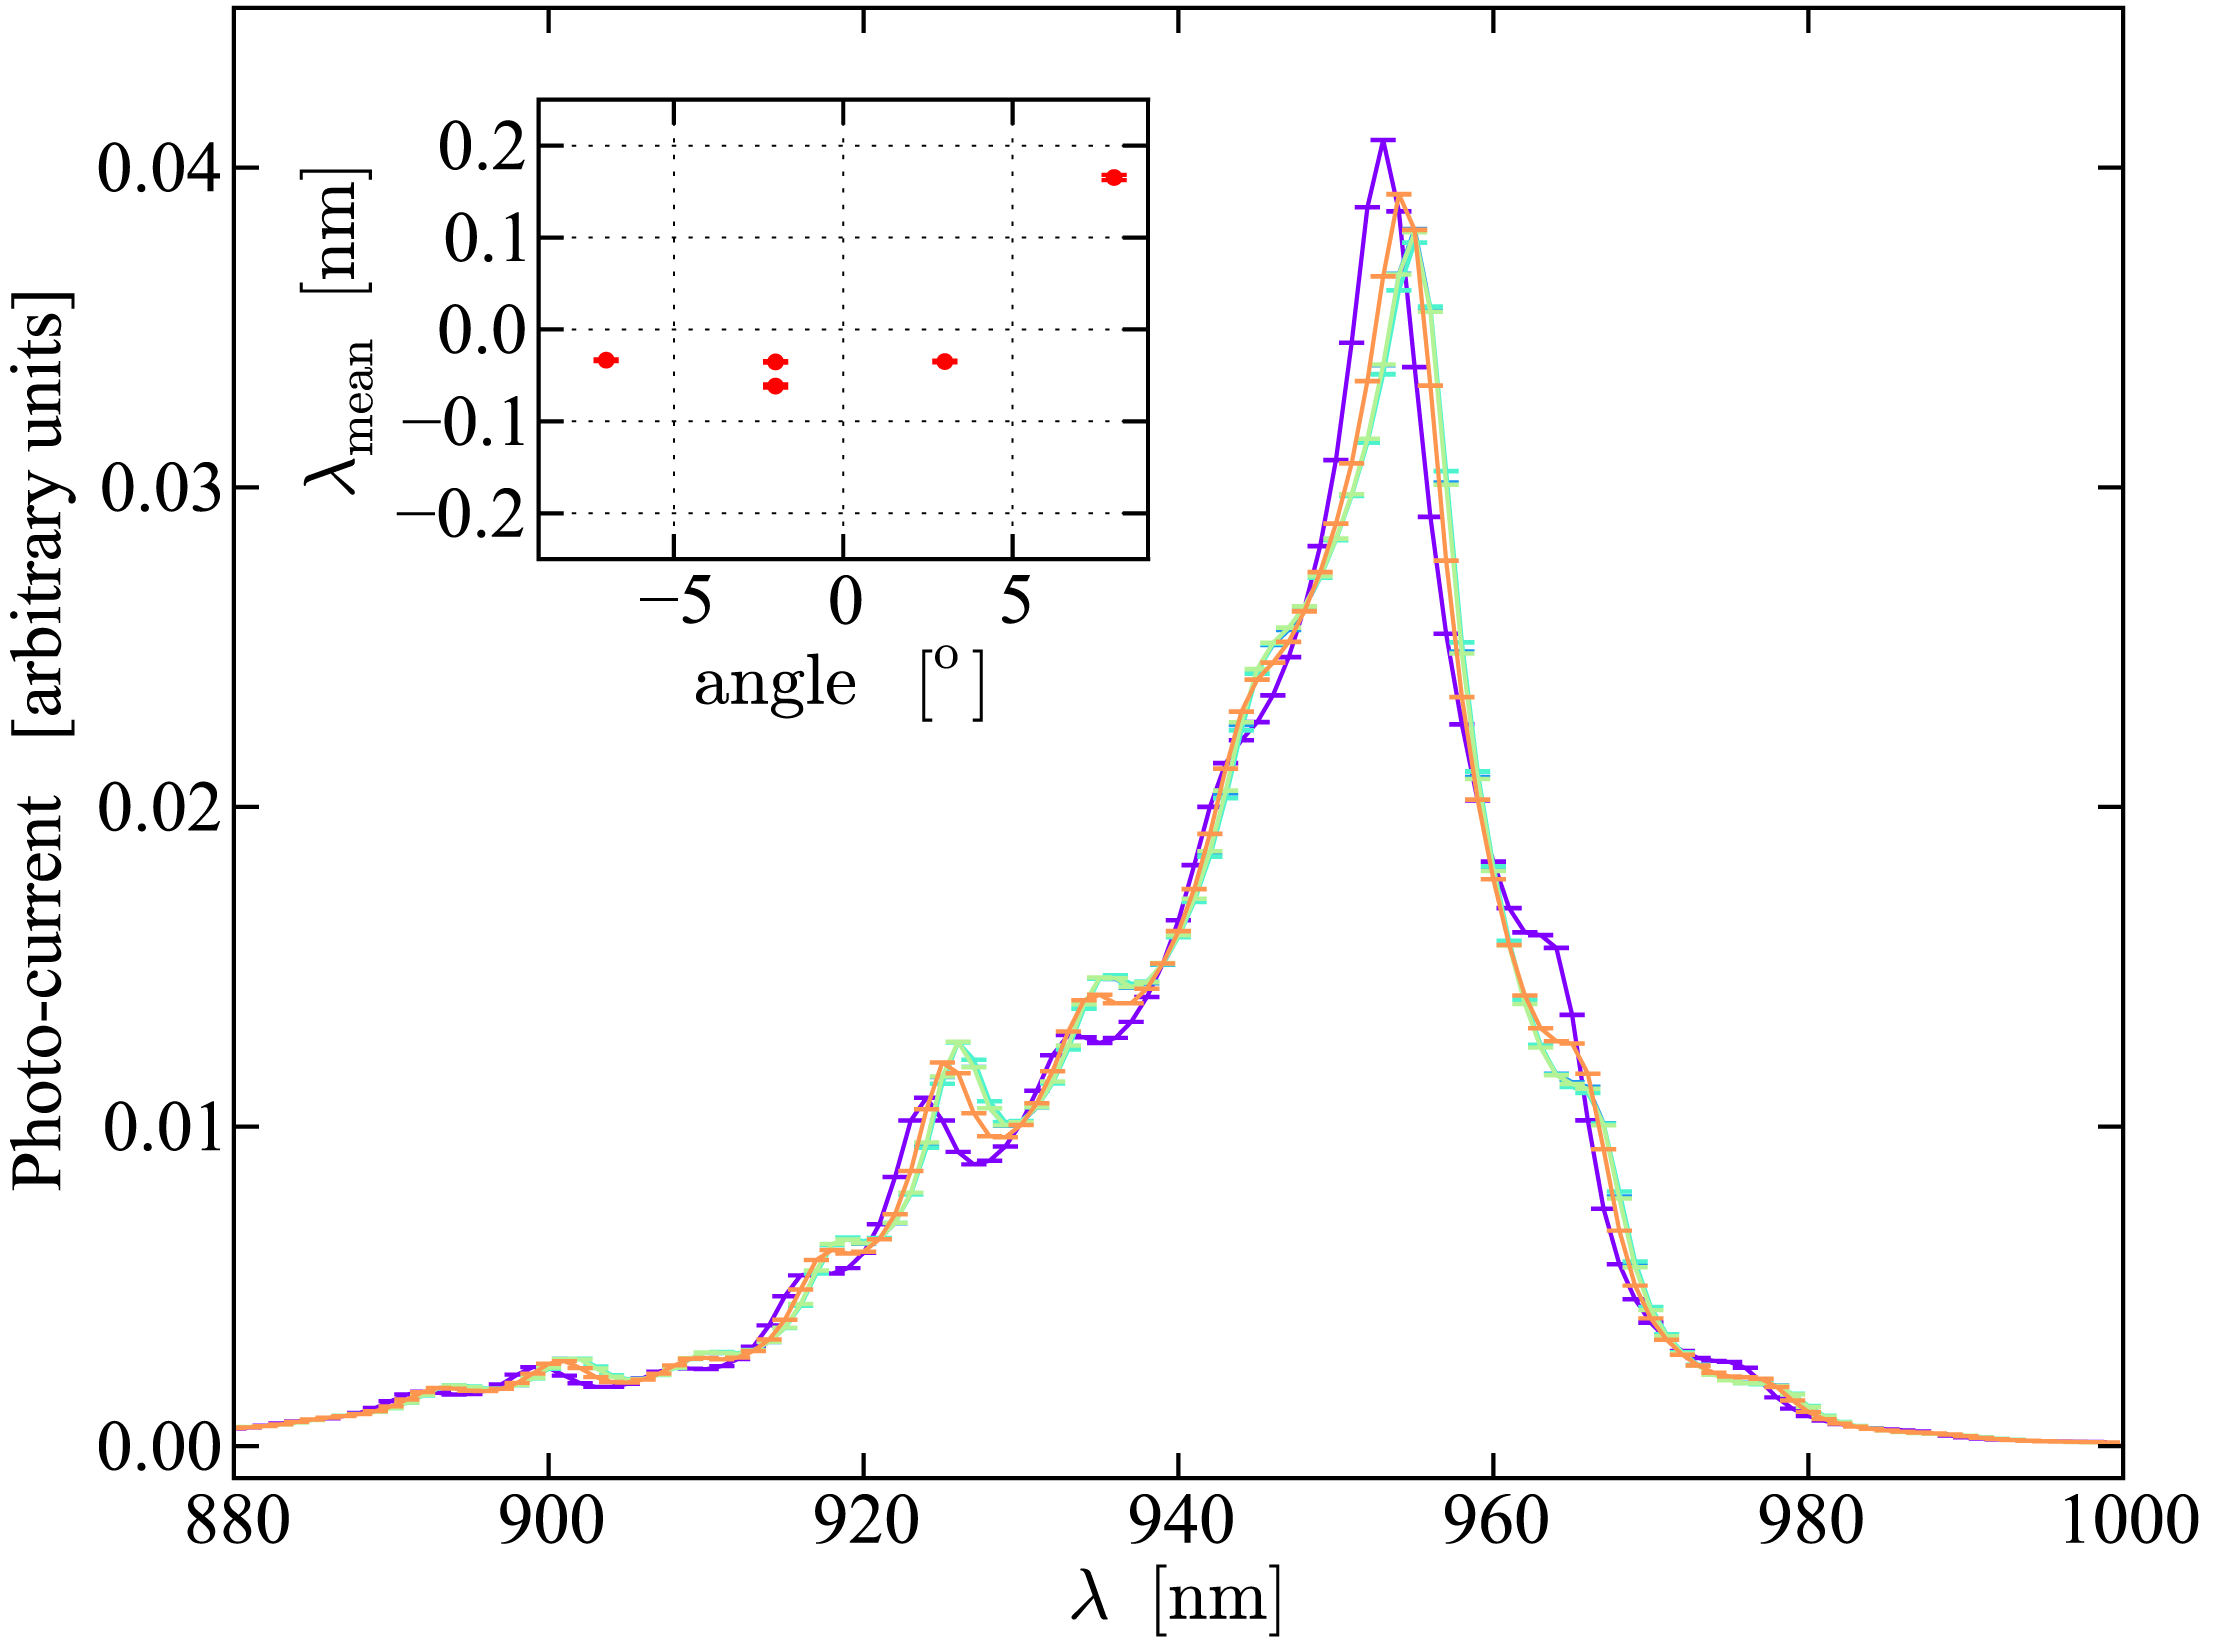
Fig. D.1

All panels show the superposition the LED spectrum models, fitted on each run. Each model therefore corresponds to a specific angle of incidence. Except for the IR emitter (SFH4203), the spectra at various angles can barely be distinguished from each other. The insets show the spectrum average wavelength ⟨λ⟩ = ∫λS(λ)dλ/∫S(λ)dλ computed on each run. This quantity varies by less than 1 Å (peak-to-peak) over a ~ 15° range. Except for SFH4203, these variations are likely to be due to residual temperature effects, which not well accounted for by the crude model used for this study.
Current usage metrics show cumulative count of Article Views (full-text article views including HTML views, PDF and ePub downloads, according to the available data) and Abstracts Views on Vision4Press platform.
Data correspond to usage on the plateform after 2015. The current usage metrics is available 48-96 hours after online publication and is updated daily on week days.
Initial download of the metrics may take a while.