Fig. 12
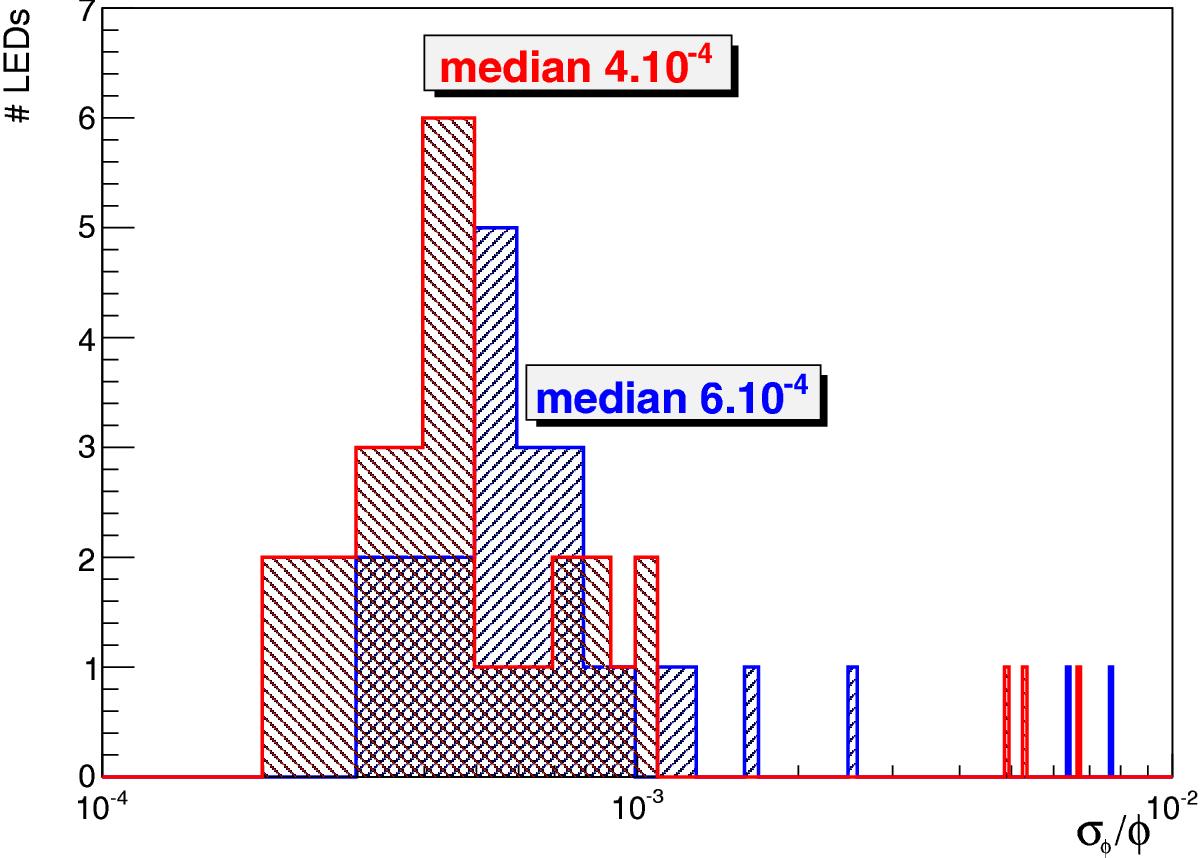
Red histogram: stability of the LED flux (i.e. the NIST photodiode current) after correction for the cooler-brighter effect (and for the backend board temperature variations). Blue histogram: stability of the LED channels after correction for the control photodiode measurements. The two outliers above 5 × 10⁻³ are LEDs in the blue histogram that correspond to channels that are intrinsically unstable. The outliers in the red histogram correspond to the same LEDs, plus one LED whose control photodiode is faulty.
Current usage metrics show cumulative count of Article Views (full-text article views including HTML views, PDF and ePub downloads, according to the available data) and Abstracts Views on Vision4Press platform.
Data correspond to usage on the plateform after 2015. The current usage metrics is available 48-96 hours after online publication and is updated daily on week days.
Initial download of the metrics may take a while.