Fig. 1
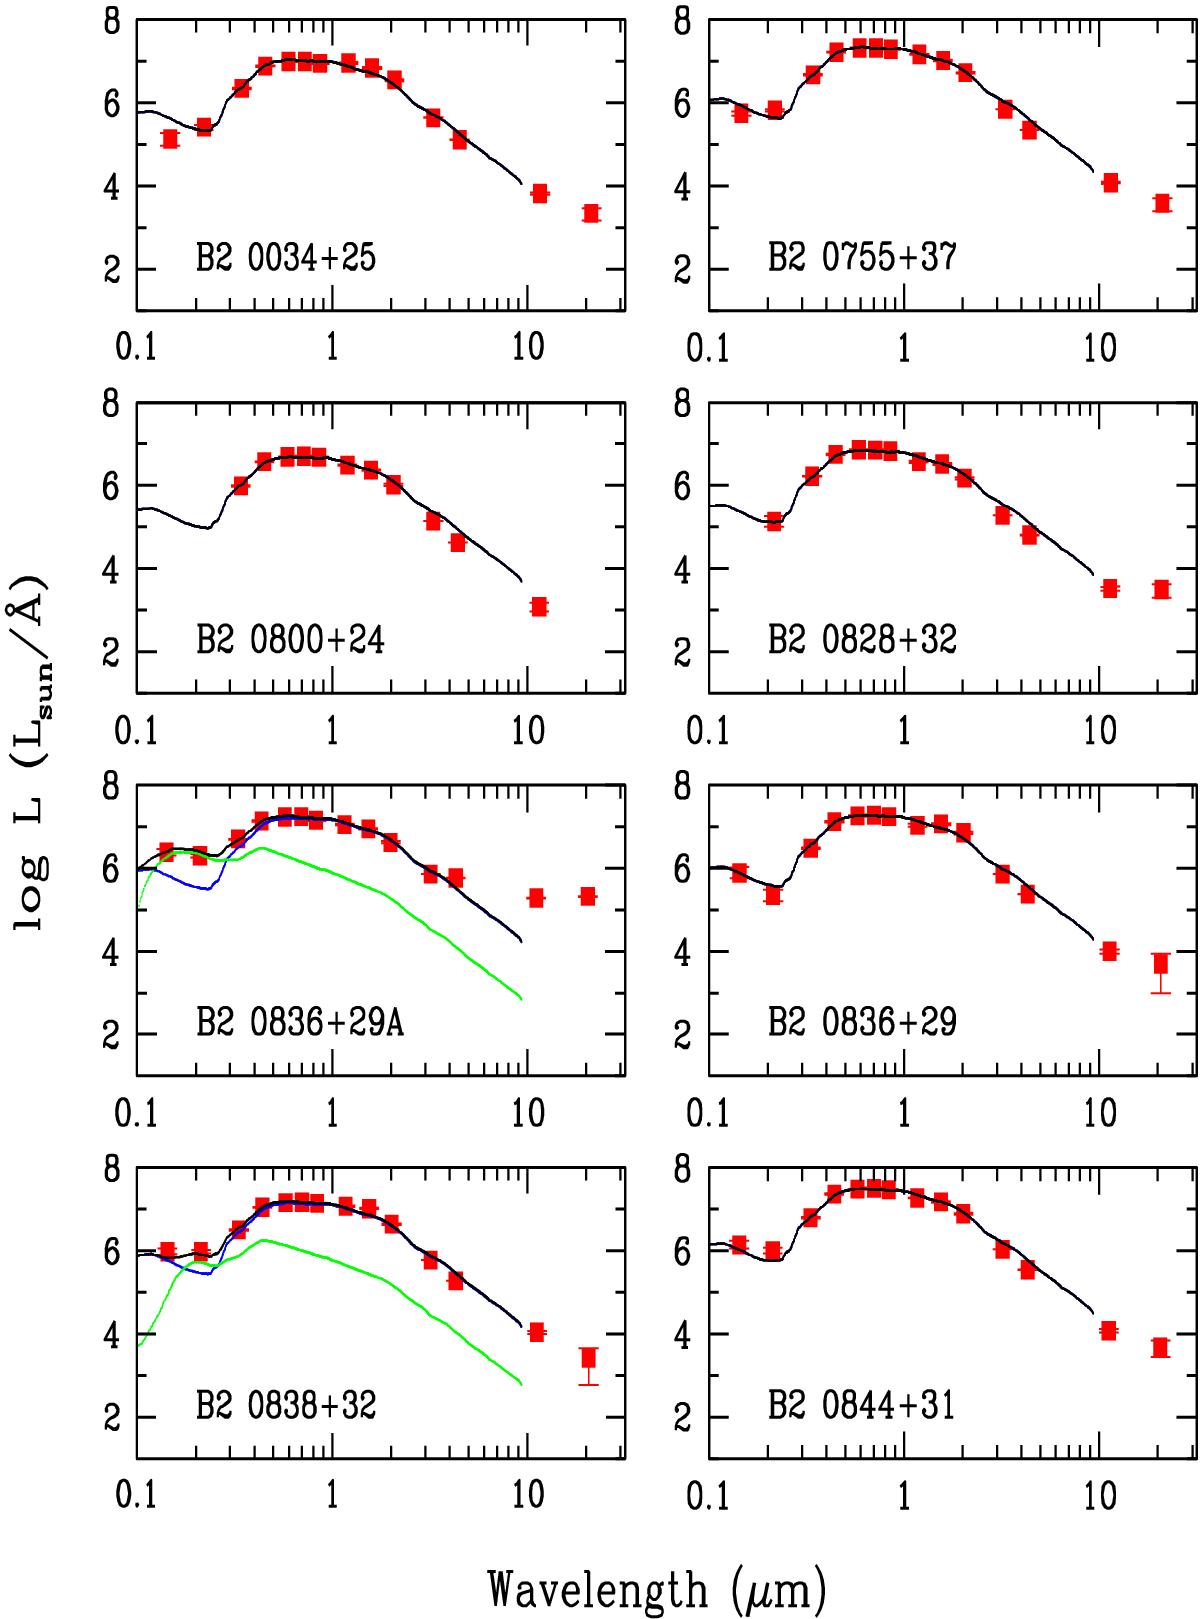
SED fits. A solid blue line represents a Bruzual & Charlot (2003) old elliptical galaxy model. A green line, if present, represents a young stellar population, and a solid black line the sum of the old and young model. In the fitting we only used GALEX, SDSS, and 2MASS data points. We also show the four WISE bands, which were not used in the fit. In a number of cases other IR data were available, and these objects are shown at the end of the figure. The complete figure is available in electronic form.
Current usage metrics show cumulative count of Article Views (full-text article views including HTML views, PDF and ePub downloads, according to the available data) and Abstracts Views on Vision4Press platform.
Data correspond to usage on the plateform after 2015. The current usage metrics is available 48-96 hours after online publication and is updated daily on week days.
Initial download of the metrics may take a while.