Free Access
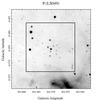
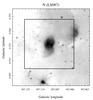
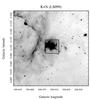
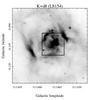
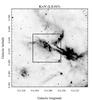
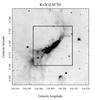
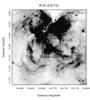
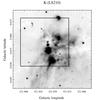
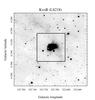
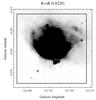
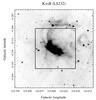
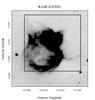
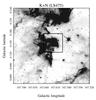
Fig. 9
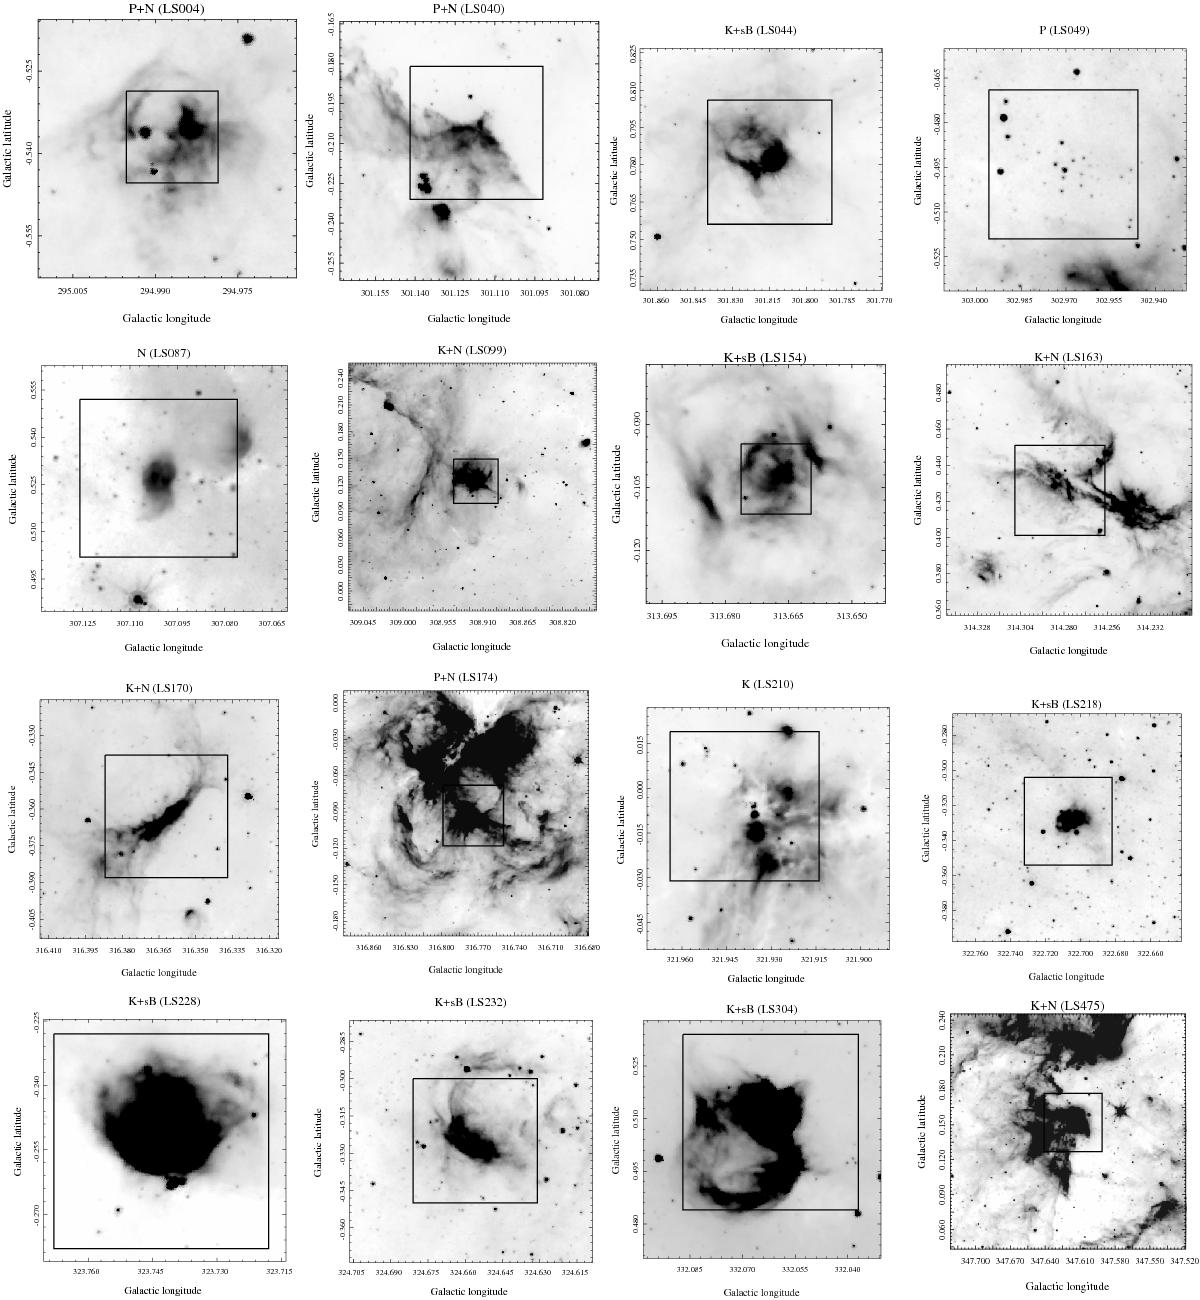
Examples of different cluster morphologies based on images in the 8 μm band obtained with the Infrared Array Camera (IRAC) on board the Spizer Space Telescope. Boxes inside each panel correspond to the cluster candidate charts shown in Fig. 1.
This figure is made of several images, please see below:
Current usage metrics show cumulative count of Article Views (full-text article views including HTML views, PDF and ePub downloads, according to the available data) and Abstracts Views on Vision4Press platform.
Data correspond to usage on the plateform after 2015. The current usage metrics is available 48-96 hours after online publication and is updated daily on week days.
Initial download of the metrics may take a while.