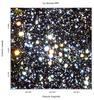
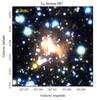
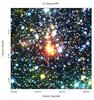
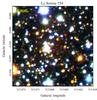
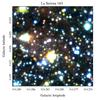
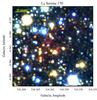
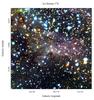
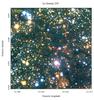
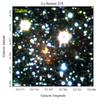
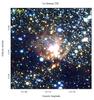
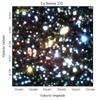
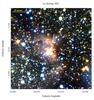
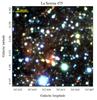
Fig. 1
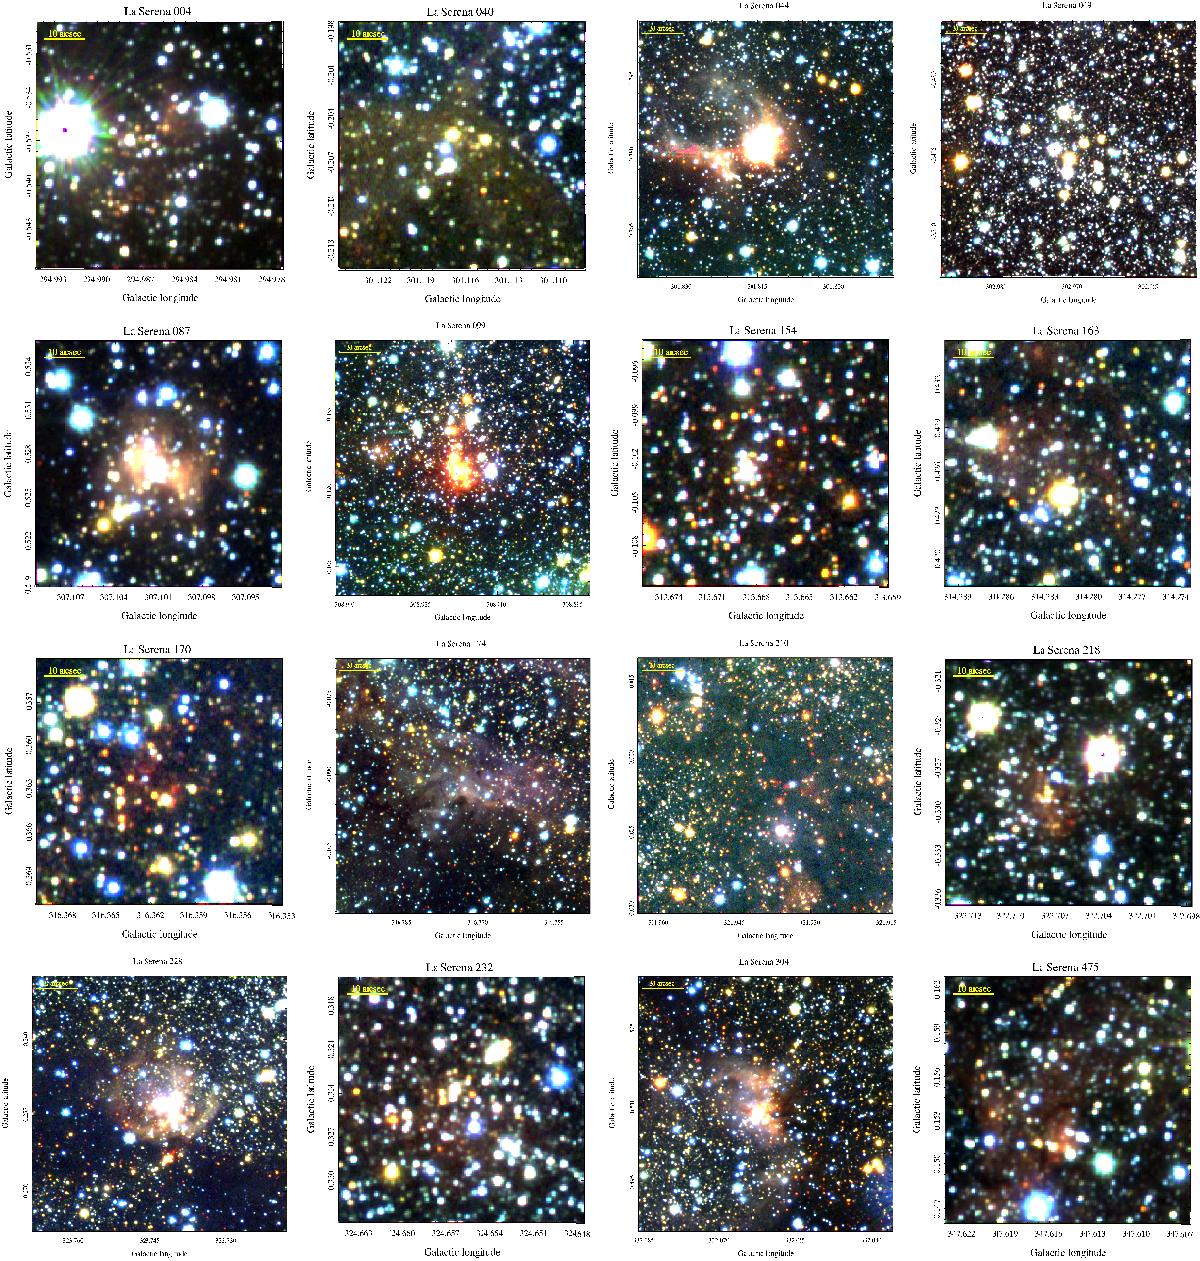
RGB color images of a representative sample of the newly discovered cluster candidates. The field-of-view for the chart of each cluster is set variously between 1 × 1 arcmin, 3 × 3 arcmin, and 5 × 5 arcmin in order to visualize the cluster comfortably. This set of clusters are the same shown in Fig. 9. The complete set of charts for the whole catalog is offered on the catalog website, see details in Sect. 3.
Current usage metrics show cumulative count of Article Views (full-text article views including HTML views, PDF and ePub downloads, according to the available data) and Abstracts Views on Vision4Press platform.
Data correspond to usage on the plateform after 2015. The current usage metrics is available 48-96 hours after online publication and is updated daily on week days.
Initial download of the metrics may take a while.