Free Access
Fig. 2
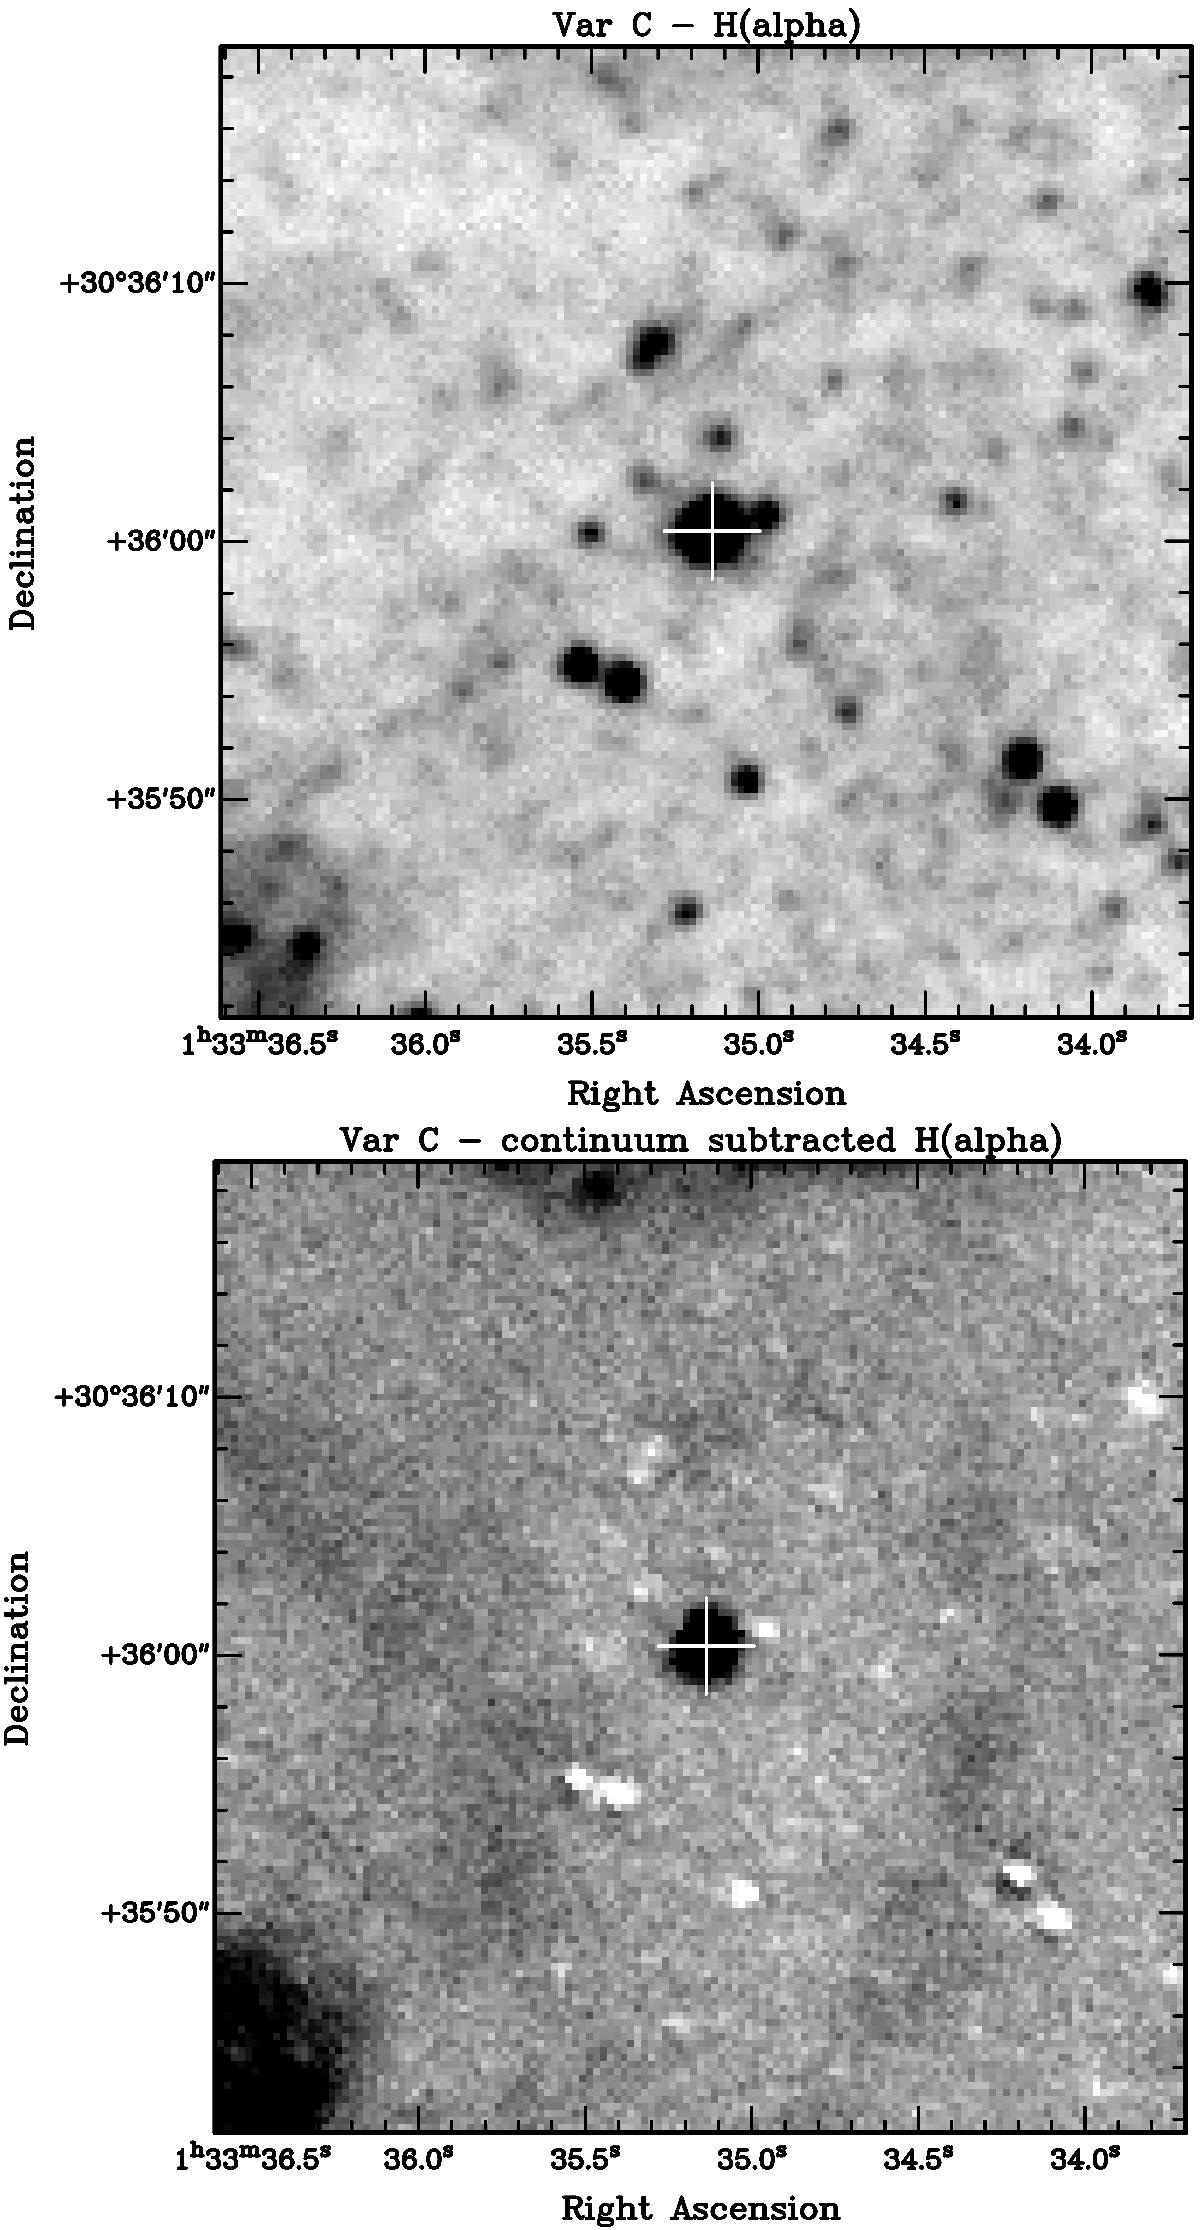
Hα-image (upper panel) and continuum-subtracted Hα-image (Hα – R; lower panel) of Var C and its surroundings. Images were produced from NOAO LGGS data and have a size of about 150 pc × 150 pc. North is up and east is to the left.
This figure is made of several images, please see below:
Current usage metrics show cumulative count of Article Views (full-text article views including HTML views, PDF and ePub downloads, according to the available data) and Abstracts Views on Vision4Press platform.
Data correspond to usage on the plateform after 2015. The current usage metrics is available 48-96 hours after online publication and is updated daily on week days.
Initial download of the metrics may take a while.