Fig. 3
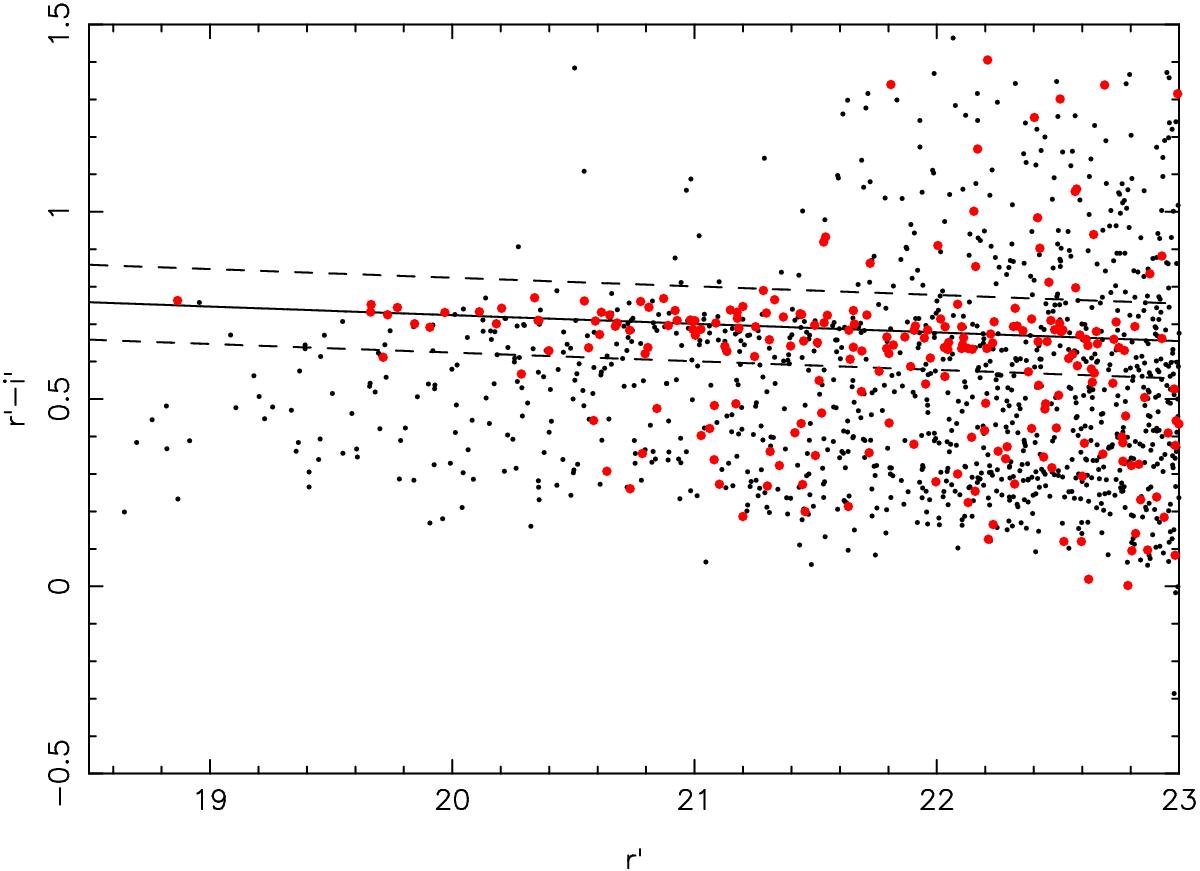
Colour−magnitude diagram in the field of MS 1621.5+2640. The black points are the galaxies located at r< 500′′ from the cluster centre. The red dots are galaxies with r< 200′′ and a zphot compatible with the cluster redshift. The straight line is the best fit to the red sequence and the dashed lines are the 3σ limits of the red sequence. At the cluster redshift (z = 0.43), the expected colour, computed with the synthetic evolutionary code of Bruzual & Charlot (2003), is r′−i′ = 0.77.
Current usage metrics show cumulative count of Article Views (full-text article views including HTML views, PDF and ePub downloads, according to the available data) and Abstracts Views on Vision4Press platform.
Data correspond to usage on the plateform after 2015. The current usage metrics is available 48-96 hours after online publication and is updated daily on week days.
Initial download of the metrics may take a while.