Free Access
Fig. 2
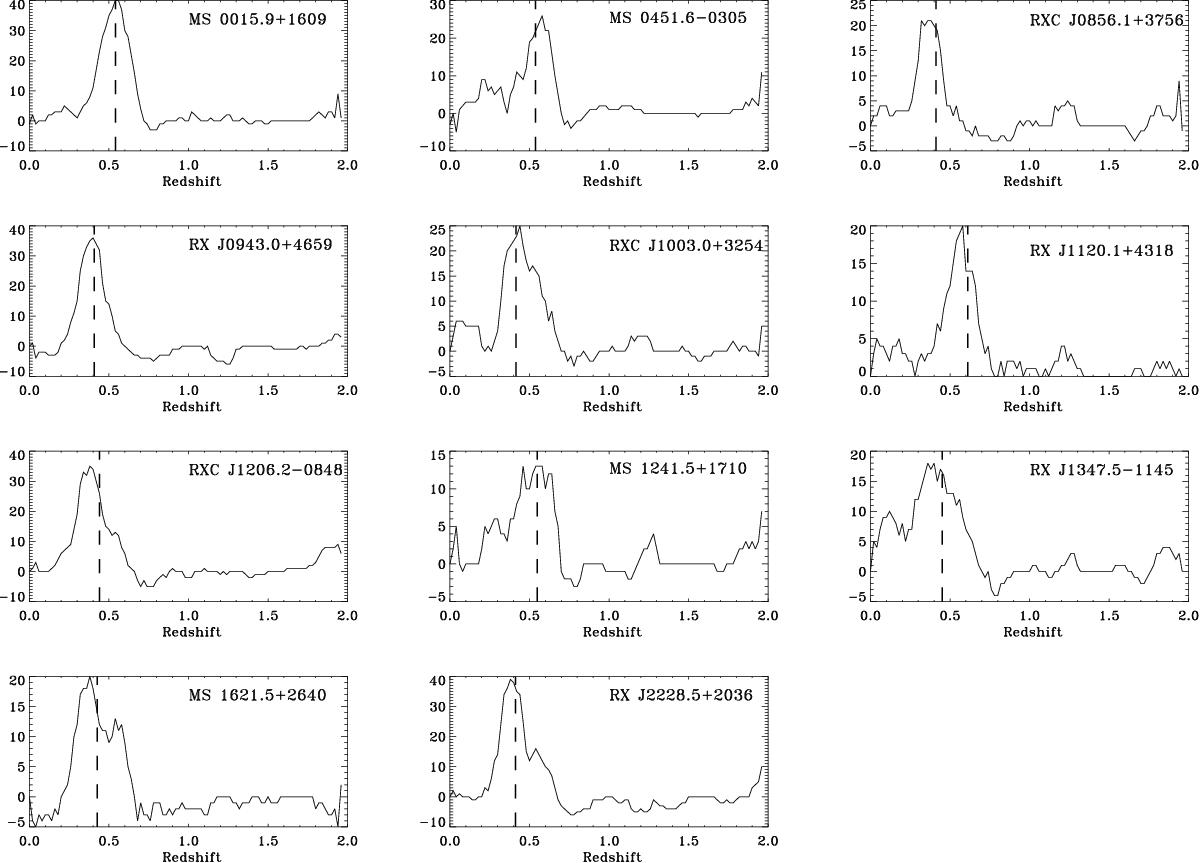
Over-densities in the photometric redshift distribution for each cluster. In each panel the vertical line shows the spectroscopic redshift of the cluster. The plot represents the redshift distribution of the central area defined as R< 5′ minus the distribution of an annulus of same area starting at R = 10′.
Current usage metrics show cumulative count of Article Views (full-text article views including HTML views, PDF and ePub downloads, according to the available data) and Abstracts Views on Vision4Press platform.
Data correspond to usage on the plateform after 2015. The current usage metrics is available 48-96 hours after online publication and is updated daily on week days.
Initial download of the metrics may take a while.