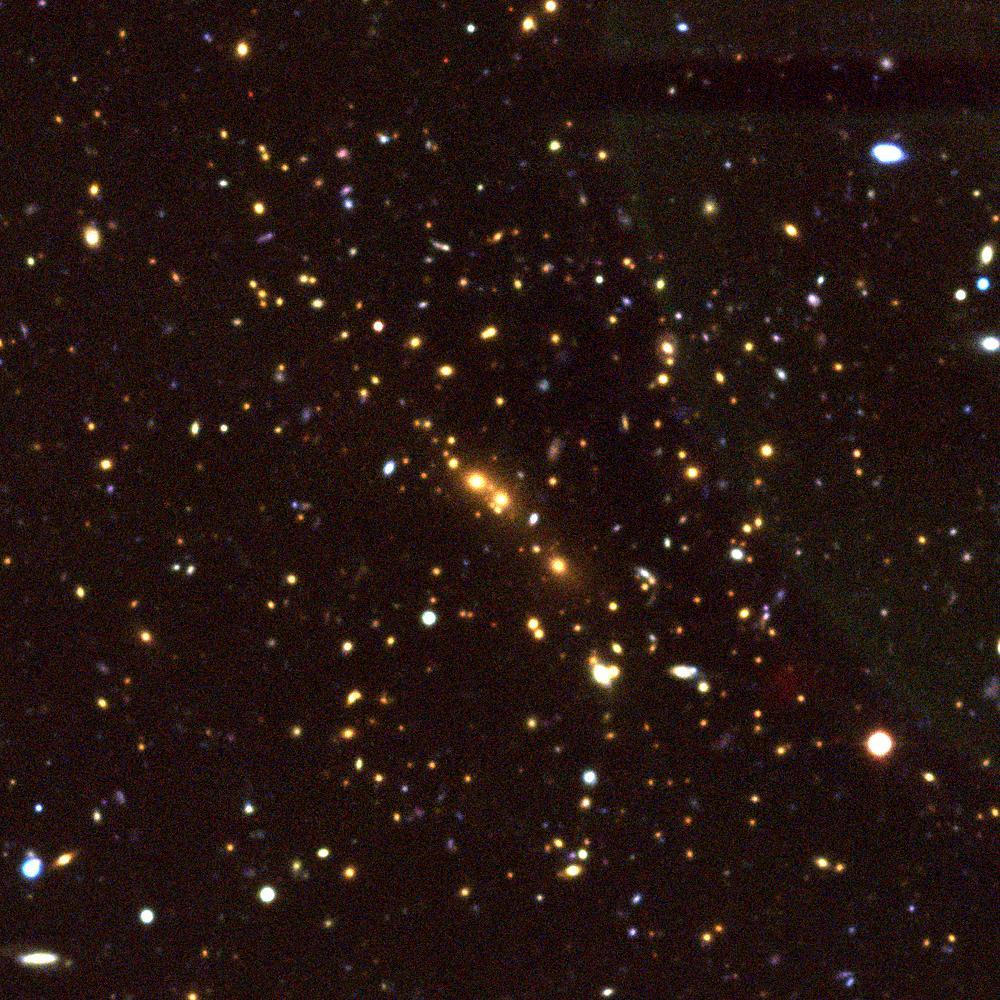
Fig. A.1
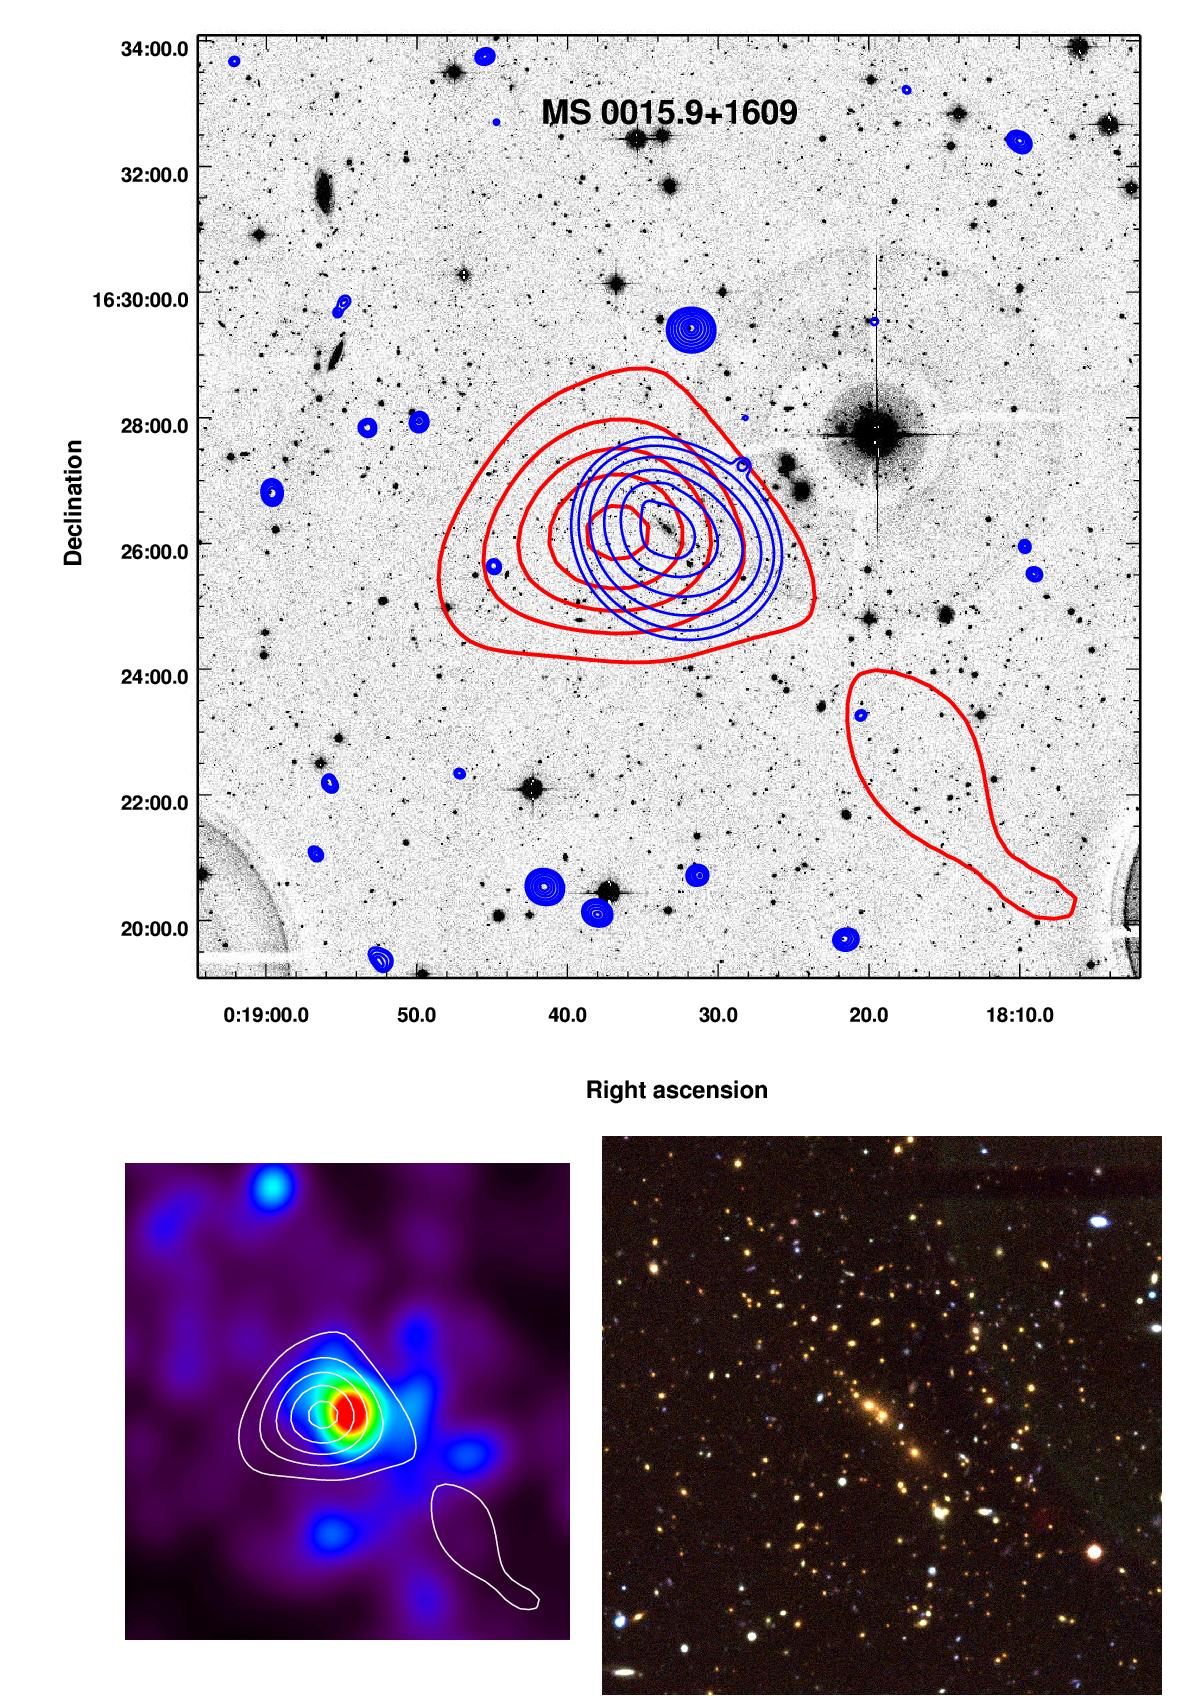
Up: 15′ × 15′ inset of the cluster field extracted from the full r′ MegaCam image. The thick red contours show the mass distribution derived from the 2D weak-lensing analysis. The contour levels are linearly spaced in σ of the mass reconstruction, starting at 2σ. The thin blue contours come from the X-ray map obtained with XMM-Newton. The image was filtered with wavelets and the contours are scaled logarithmically. Bottom left: same mass isocontours overlaid on the galaxy luminosity distribution where cluster members are selected within the cluster red sequence and mr< 23. Bottom right: true colour image of the cluster centre from g′, r′, i′ combination. The field of view is 3′ × 3′.
Current usage metrics show cumulative count of Article Views (full-text article views including HTML views, PDF and ePub downloads, according to the available data) and Abstracts Views on Vision4Press platform.
Data correspond to usage on the plateform after 2015. The current usage metrics is available 48-96 hours after online publication and is updated daily on week days.
Initial download of the metrics may take a while.