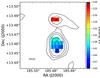
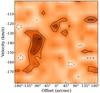
Fig. 2
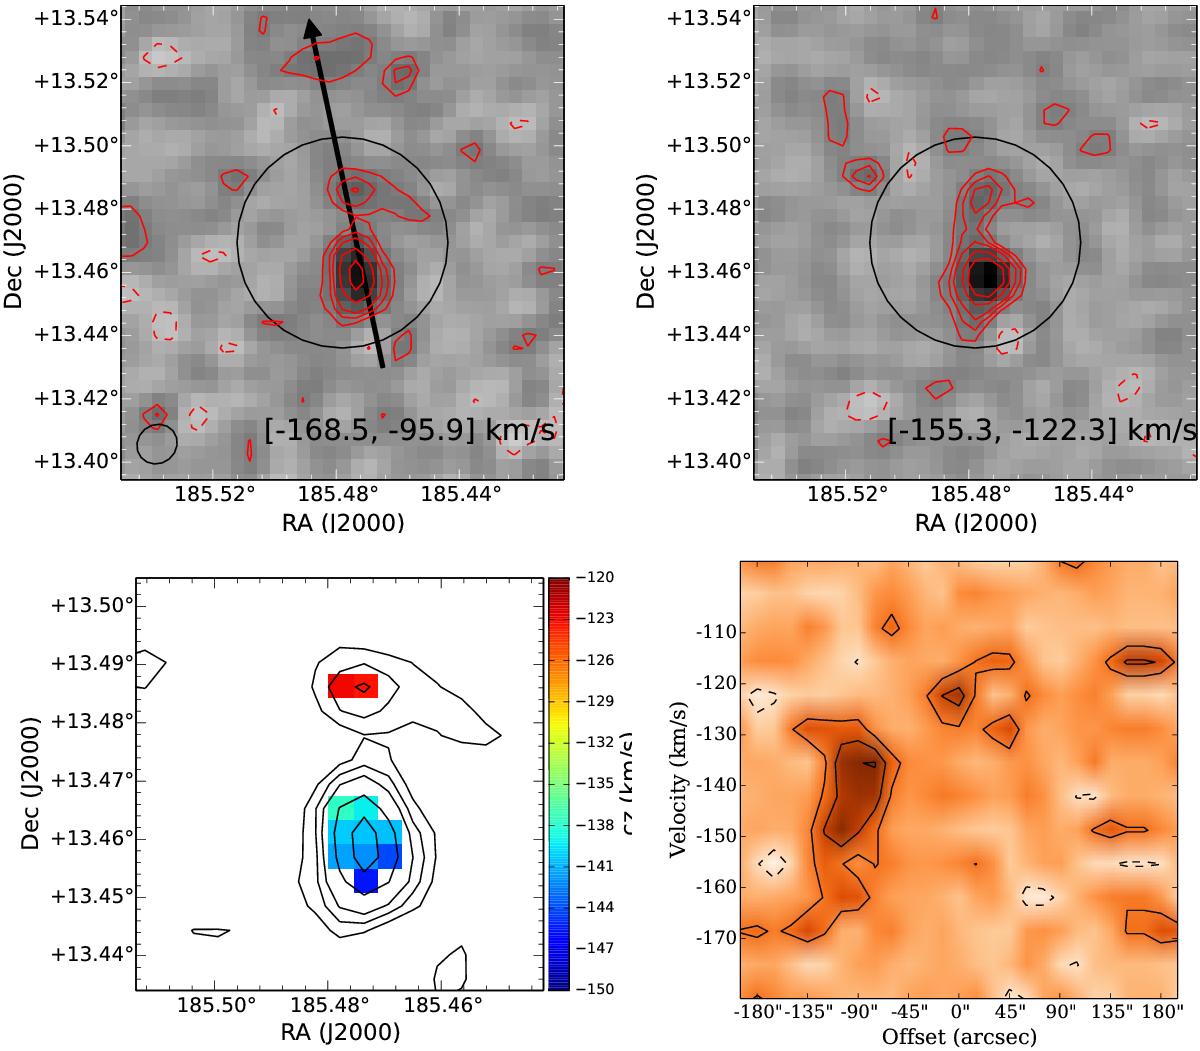
Top: total intensity H i maps for the two channel ranges. Contours show the (–2, 2, 3, 4, 6, 8) × rms value for each map (0.018 and 0.015 Jy km s-1). The 4′ AO beam is shown as the large circle for reference. The synthesized VLA beam is shown as the small circle in the top-left figure. Bottom left: H i intensity contours from the full spectral range H i map (upper left) overlaid on the velocity field from Gaussian fitting. Bottom right: position-velocity slice along the arrow shown in the upper left with contours at (–2, 2, 4, 6) × rms (1 mJy bm-1).
Current usage metrics show cumulative count of Article Views (full-text article views including HTML views, PDF and ePub downloads, according to the available data) and Abstracts Views on Vision4Press platform.
Data correspond to usage on the plateform after 2015. The current usage metrics is available 48-96 hours after online publication and is updated daily on week days.
Initial download of the metrics may take a while.