Fig. 3
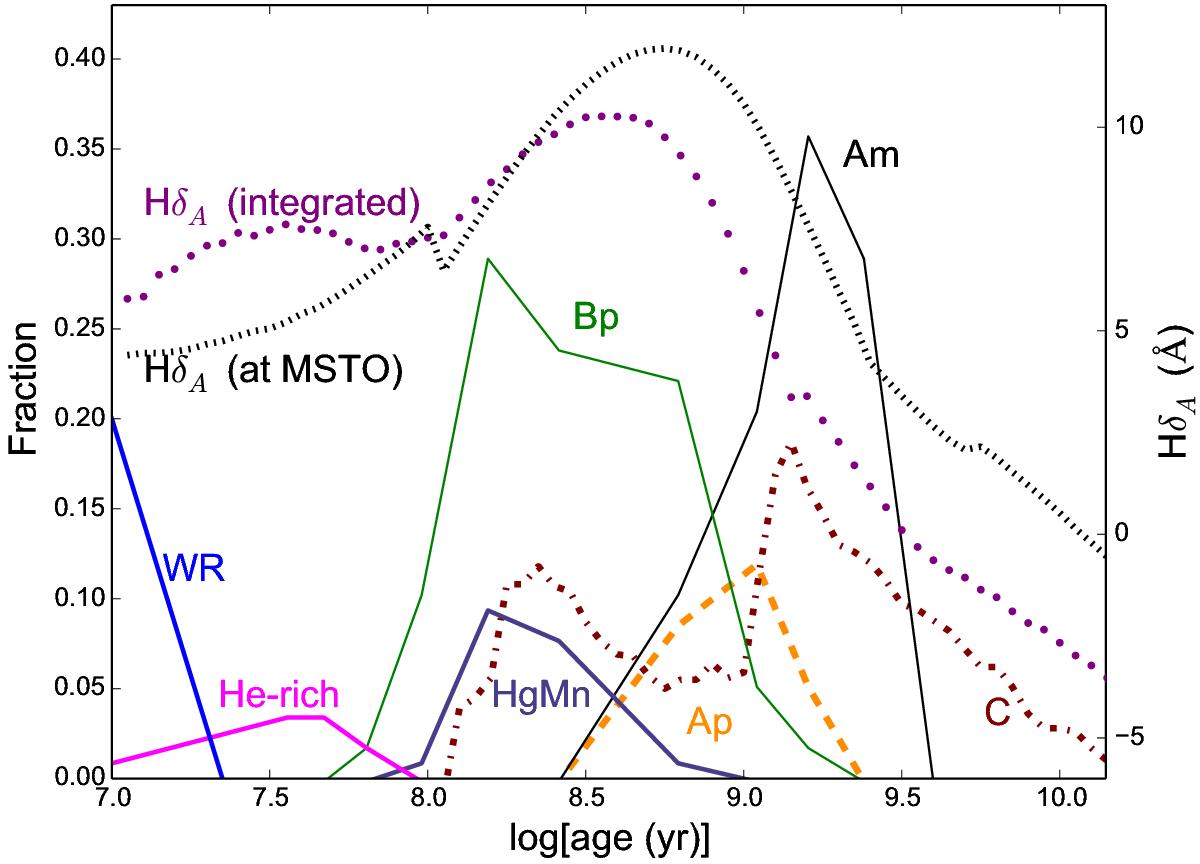
Schematic time line showing the age indicators. The HδA index (Worthey & Ottaviani 1997) for the hottest star near the main-sequence turnoff (MSTO; black broken line) and for the integrated light of the simple stellar population of solar abundance (purple dots) refer to the right-hand axis. The remainder of the lines refer schematically to the left-hand axis. The Wolf-Rayet fraction (blue line) is entirely schematic. The lines for He-rich (magenta line), Hg-Mn (slate blue line), Bp (thin green line), Ap (dashed orange line), and Am (thin black line) stars are estimated from data in North (1993) with approximate stellar mass converted to a MSTO age and an overall normalization estimated from Bright Star Catalog classifications (Smith 1996). The line for C stars (dash-dotted maroon line) is from the models, and therefore refers to the theoretical predictions of Marigo et al. (2008), and is expressed as the fraction of C stars compared with the total number of AGB stars in the population. Smith (1996) finds significantly more Am and HgMn stars and somewhat fewer Bp stars than North (1993). In this figure, the Bp star category includes both Si-strong and He-weak types, which transition at a boundary approximately where HgMn stars peak. There is probably a sharper boundary between Ap and Bp than is evident in this figure, and the old-age Am boundary is uncertain due to scarcity of data.
Current usage metrics show cumulative count of Article Views (full-text article views including HTML views, PDF and ePub downloads, according to the available data) and Abstracts Views on Vision4Press platform.
Data correspond to usage on the plateform after 2015. The current usage metrics is available 48-96 hours after online publication and is updated daily on week days.
Initial download of the metrics may take a while.