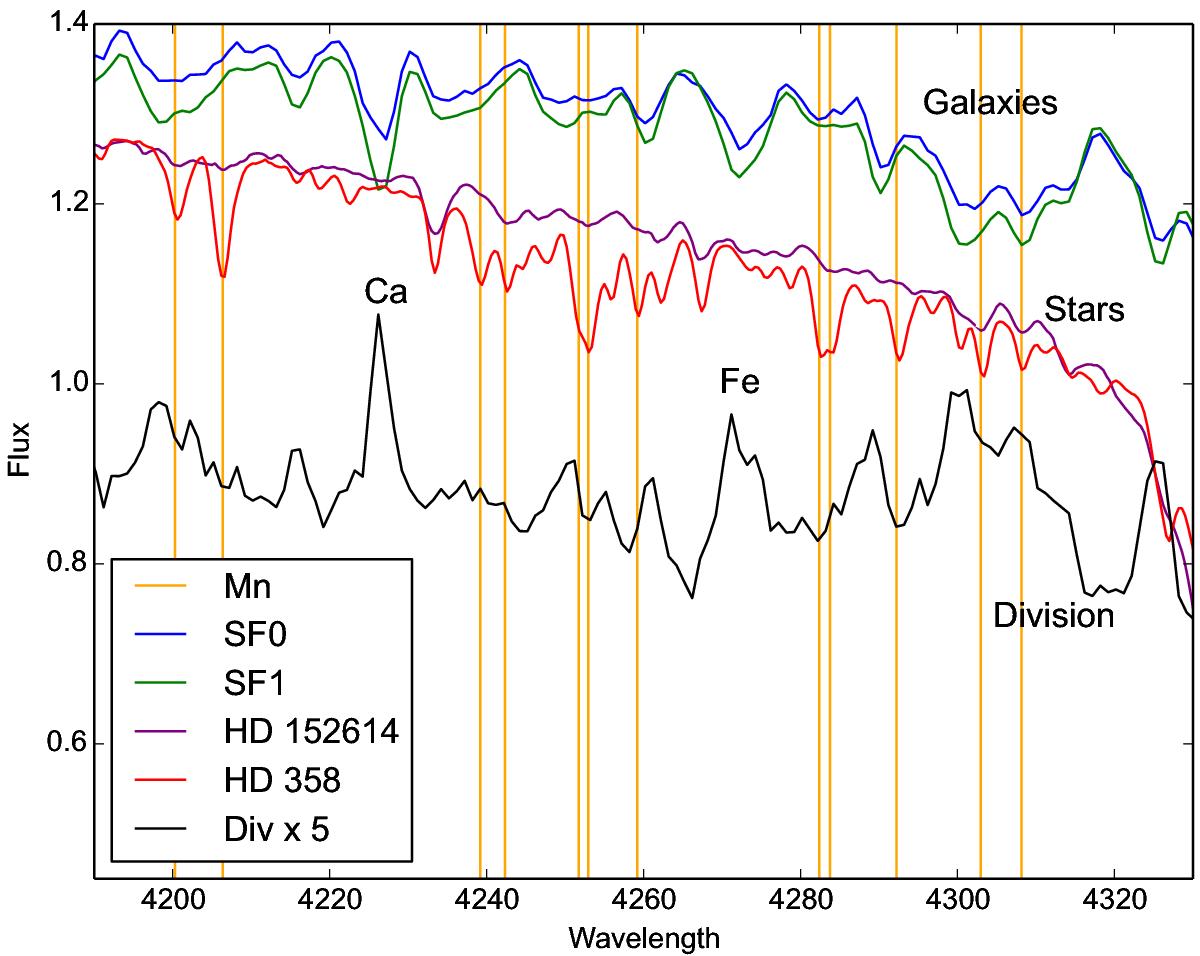
Fig. 1

Portion of the spectrum between Hδ and Hγ. Average galaxy spectra of categories SF0 (blue) and SF1 (green) from Dobos et al. (2012) and their division scaled about the average by a factor of five (black) are shown along with normal B8 star HD 152614 (ι Oph; purple) and HgMn star HD 358 (α And; red) from Valdes et al. (2004). Wavelengths of Mn transitions (Kramida & Sansonetti 2013) are marked as orange vertical lines. The feature of keenest interest is that the four strongest Mn features in HD 358 appear as small differential absorptions as one goes from SF1 to SF0 average galaxies.
Current usage metrics show cumulative count of Article Views (full-text article views including HTML views, PDF and ePub downloads, according to the available data) and Abstracts Views on Vision4Press platform.
Data correspond to usage on the plateform after 2015. The current usage metrics is available 48-96 hours after online publication and is updated daily on week days.
Initial download of the metrics may take a while.


