Fig. 9
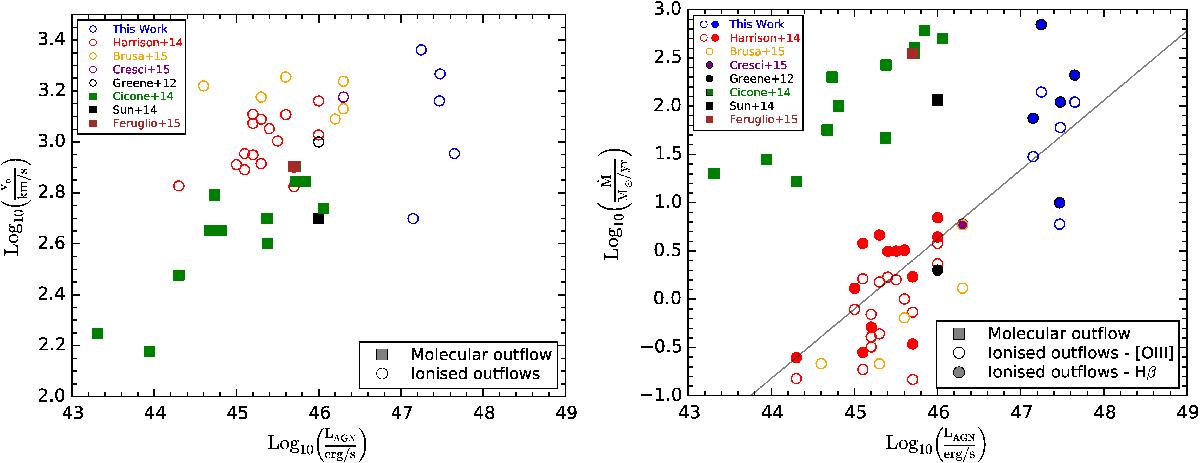
Left panel: outflow velocity as a function of the AGN bolometric luminosity. The blue circles denote the results from this work; the open circles mark the velocities of ionised gas (mainly [Oiii]λ5007): the red, orange, purple, and black circles are the estimates obtained from Harrison et al. (2014), Brusa et al. (2015), Cresci et al. (2015), and Greene et al. (2012), respectively. The green, black, and brown squares denote the velocities of the molecular outflows from Cicone et al. (2014), Sun et al. (2014), and Feruglio et al. (2015). Right panel: outflow rates as a function of the AGN bolometric luminosity. Notation is the same as in the left panel, expect that open circles represent the estimates obtained with [OIII]-inferred masses, while the filled ones denote the estimates based on Hβ. We recalculated the outflow properties inferred by previous works to make them consistent with our estimates (see text). The solid line is the best-fit relation to the averages of filled and empty circles.
Current usage metrics show cumulative count of Article Views (full-text article views including HTML views, PDF and ePub downloads, according to the available data) and Abstracts Views on Vision4Press platform.
Data correspond to usage on the plateform after 2015. The current usage metrics is available 48-96 hours after online publication and is updated daily on week days.
Initial download of the metrics may take a while.