Free Access
Fig. 5
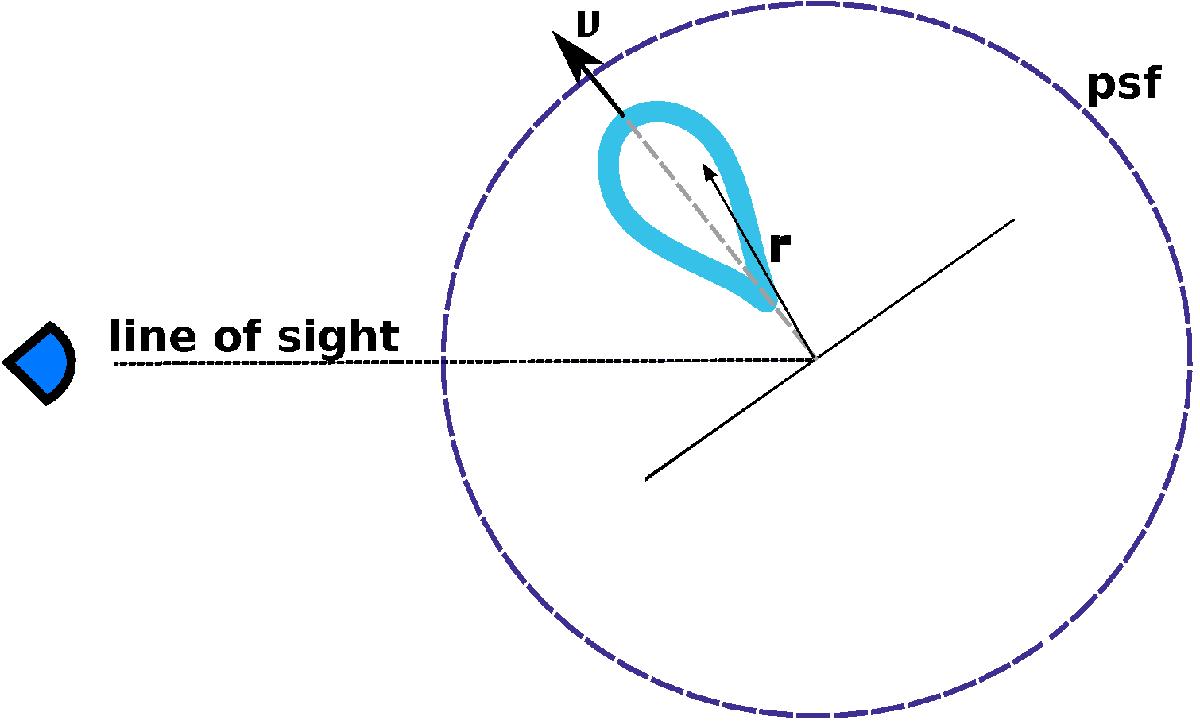
Cartoon showing the basic structure of our model. The outflow (solid blue curve) is perpendicular to the galaxy plane. v indicates the direction of the outflow and r is the distance from the QSO. This model assumes that the outflow is marginally resolved but it is not larger than the PSF dimension (dashed purple line).
Current usage metrics show cumulative count of Article Views (full-text article views including HTML views, PDF and ePub downloads, according to the available data) and Abstracts Views on Vision4Press platform.
Data correspond to usage on the plateform after 2015. The current usage metrics is available 48-96 hours after online publication and is updated daily on week days.
Initial download of the metrics may take a while.