Fig. 4
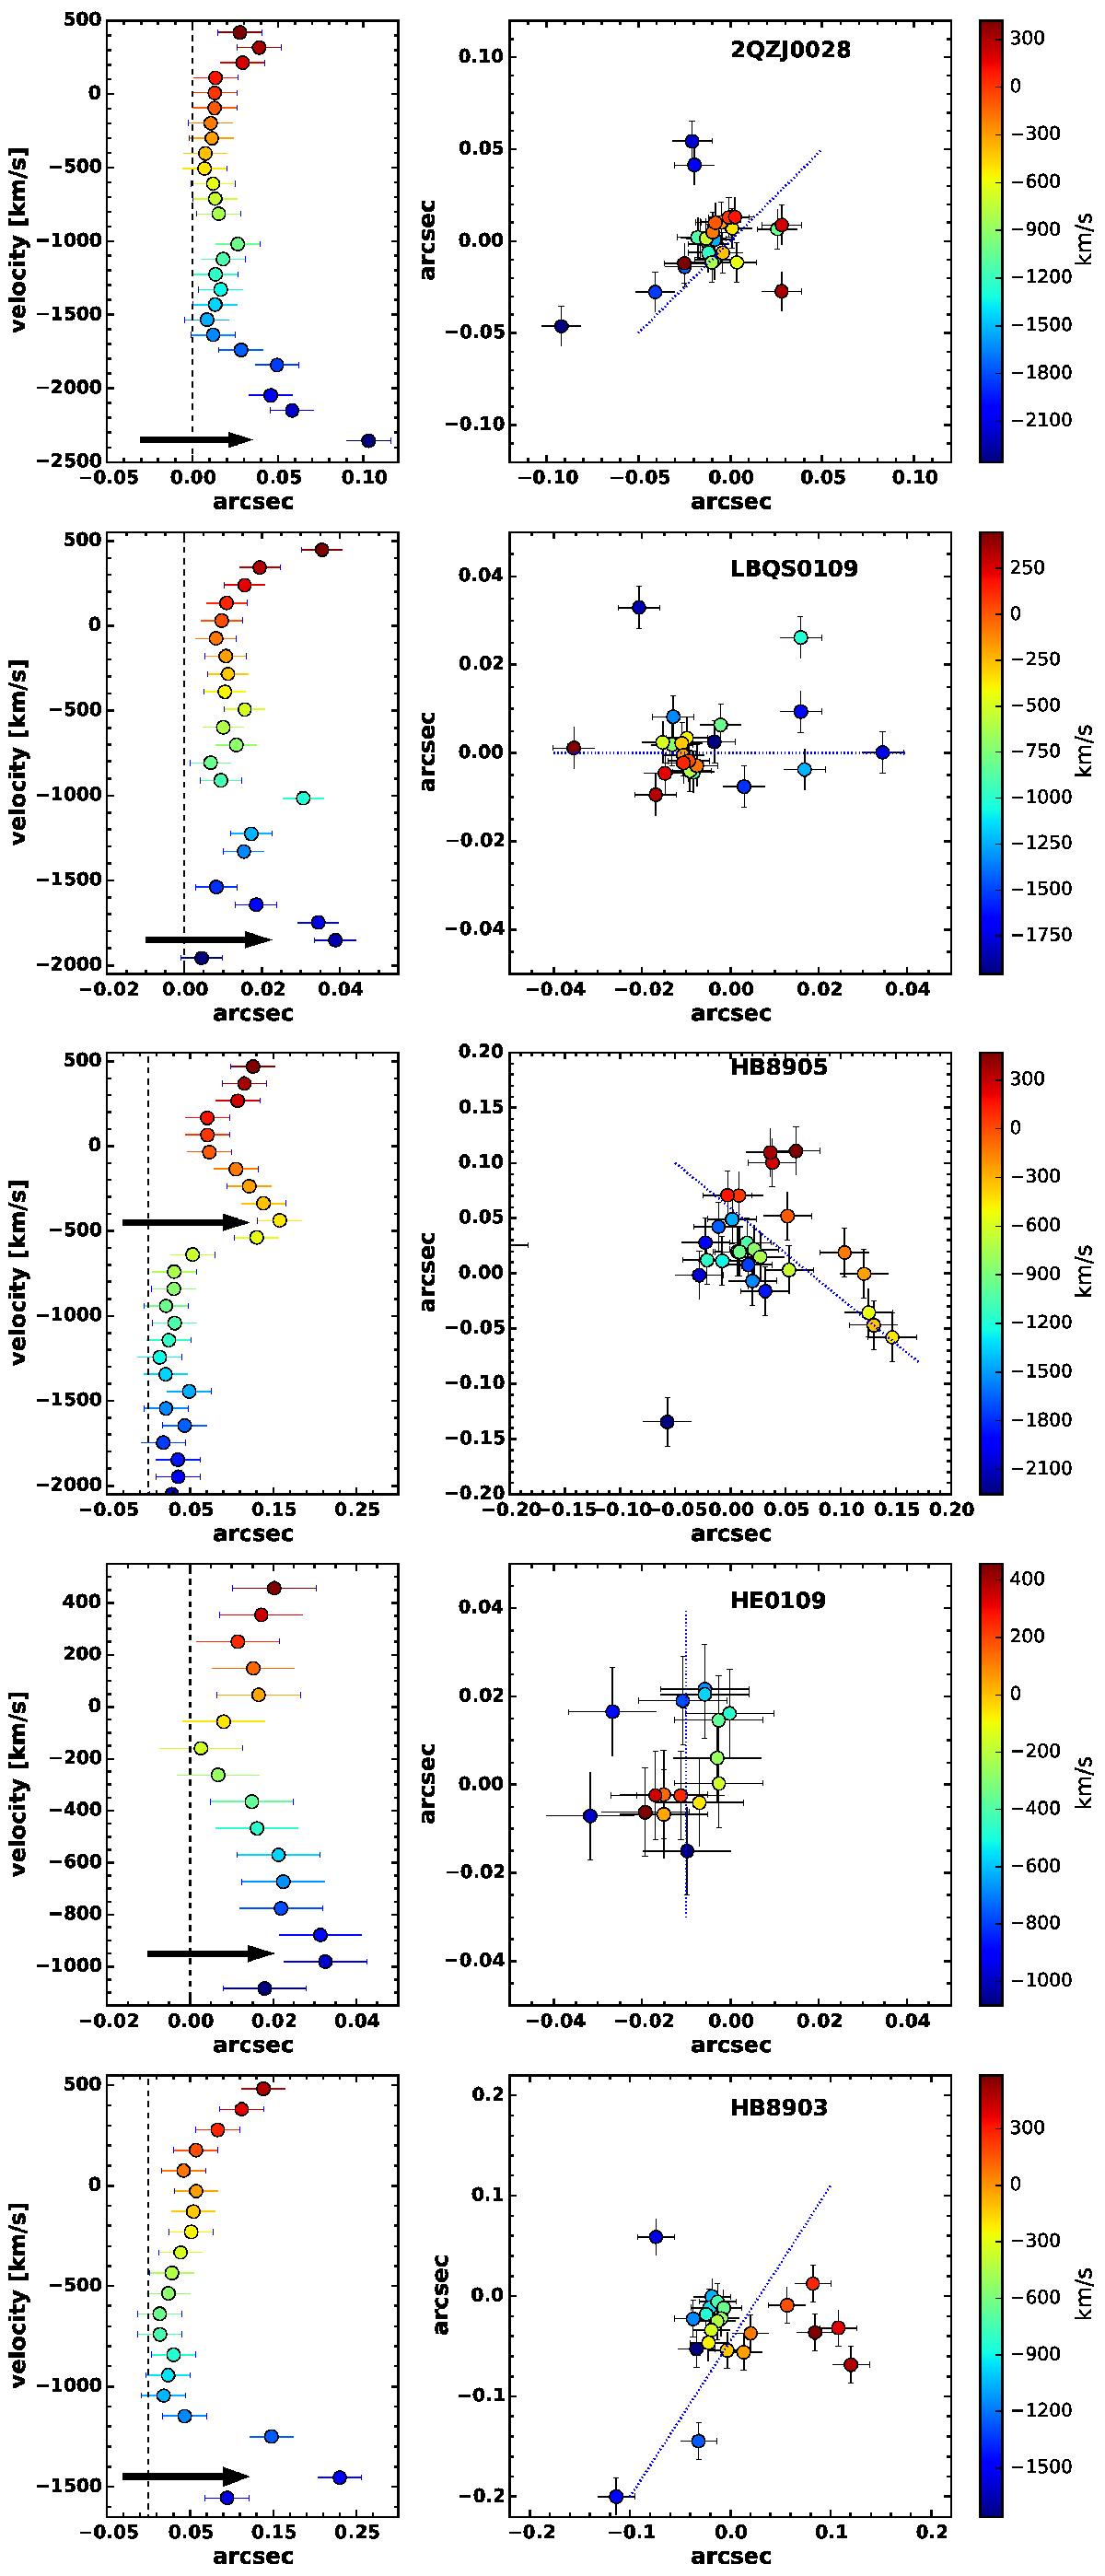
Left panels: the points show the [Oiii]λ5007 velocity v versus the distance R of the [Oiii]λ5007 photocentre from the continuum (indicated by the dashed line). The arrows indicate the velocity vo = v(Ro) corresponding to the distance R0. Right panels: [Oiii]λ5007 photocentre position in the field of view. Symbols are coloured according to their velocity (the velocity scale is reported in the colour bar). The dotted line indicates the project direction of the outflow as inferred by comparing the spectroastrometry results with velocity maps (Fig. 3).
Current usage metrics show cumulative count of Article Views (full-text article views including HTML views, PDF and ePub downloads, according to the available data) and Abstracts Views on Vision4Press platform.
Data correspond to usage on the plateform after 2015. The current usage metrics is available 48-96 hours after online publication and is updated daily on week days.
Initial download of the metrics may take a while.