Fig. 2
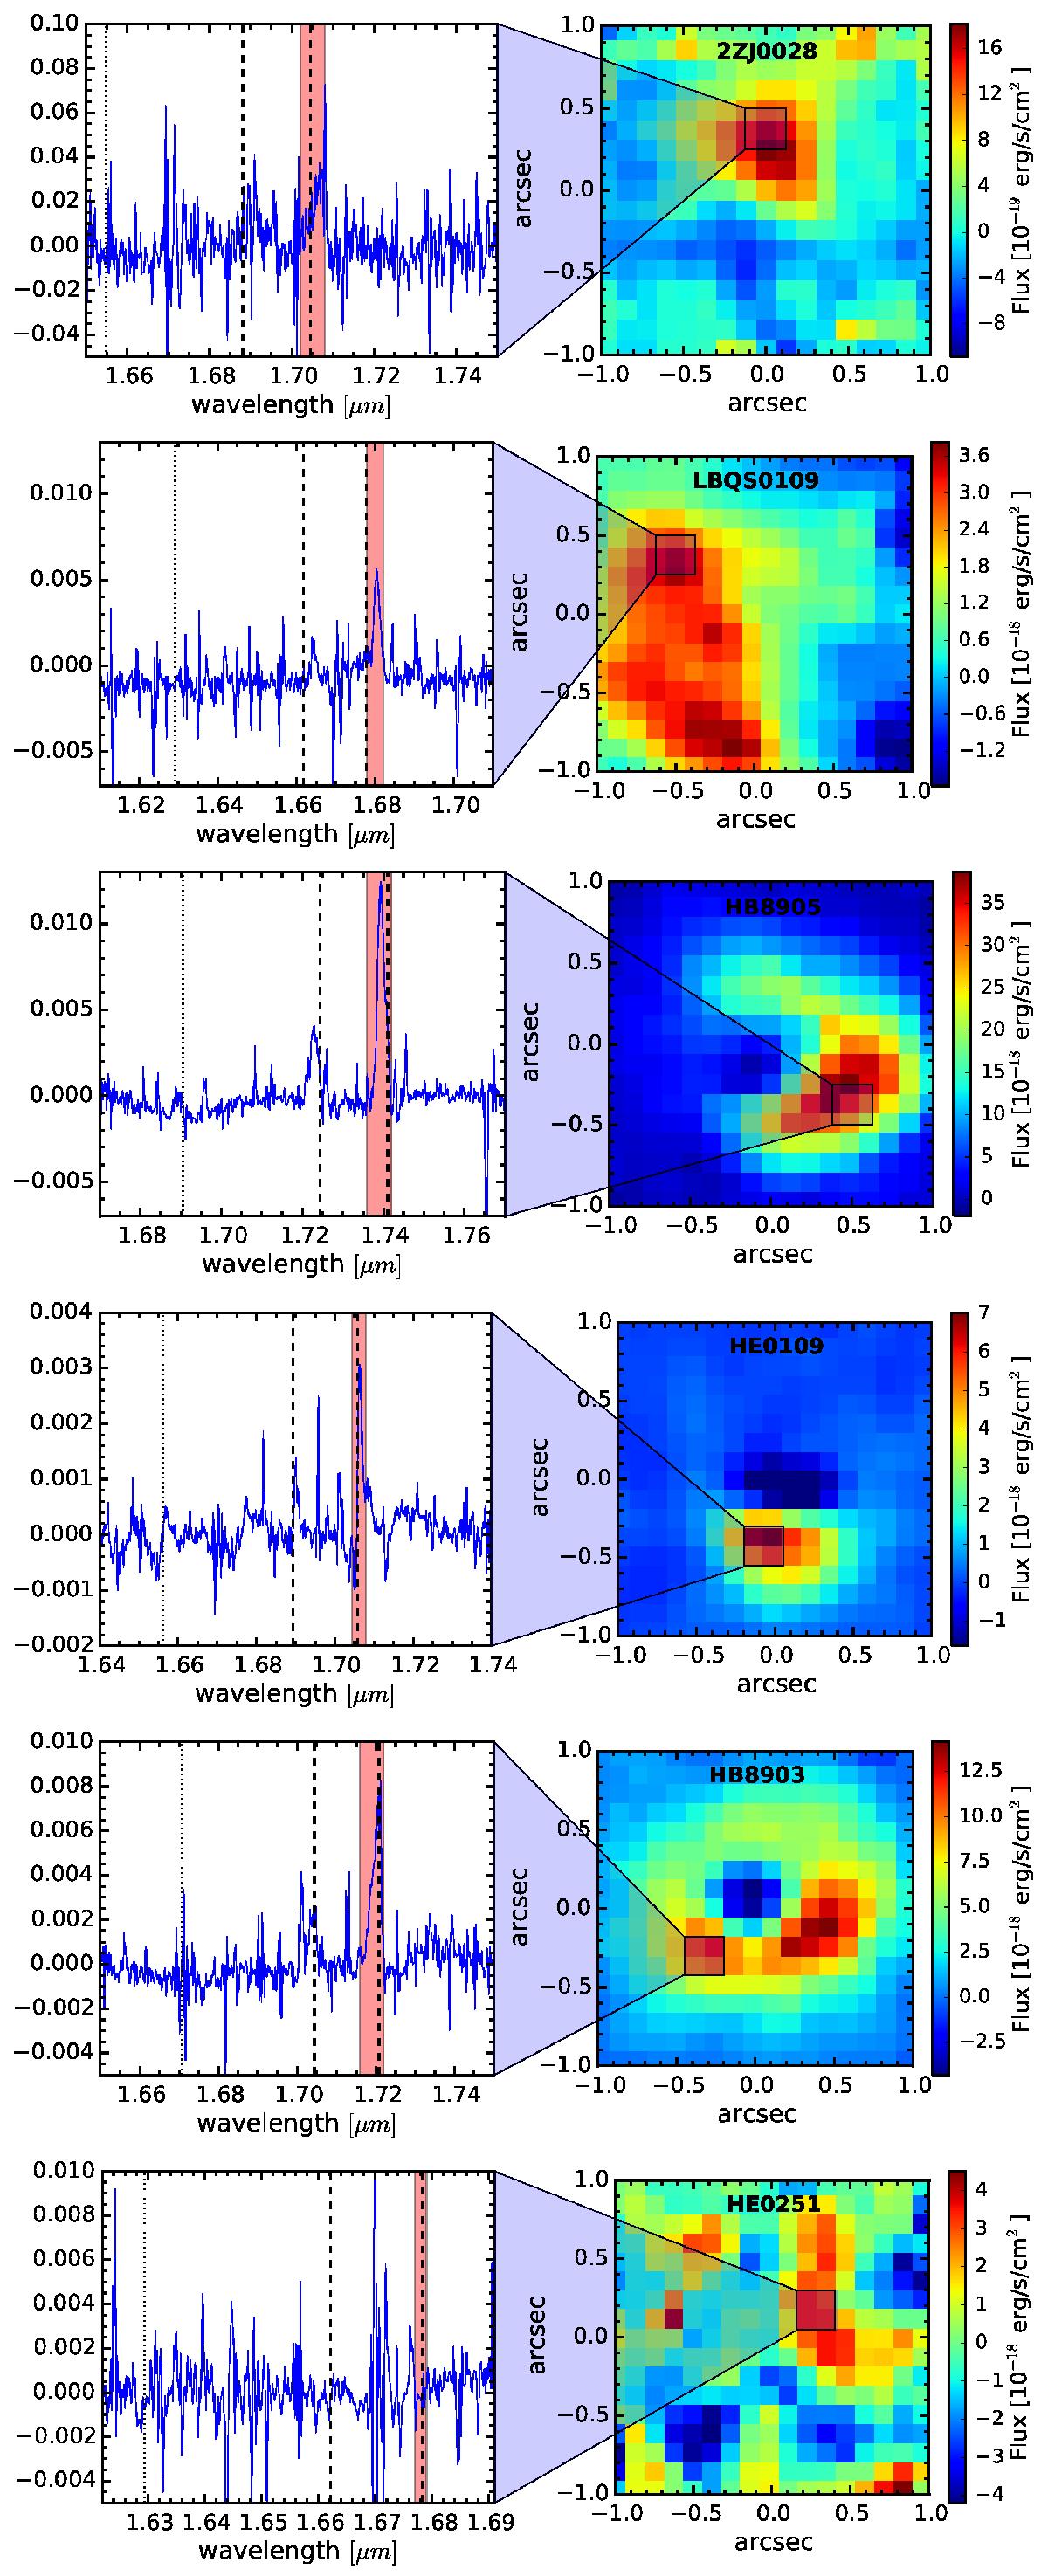
Residuals from the pixel-per-pixel fitting assuming that the QSO emission is not spatially resolved. Left panels: residual spectra extracted from a region of 0.25′′× 0.25′′, where the residual map, obtained by collapsing the [Oiii]λ5007 spectral channel, probably shows a spatially resolved emission. Dashed lines indicate the wavelength of the doublet [Oiii]λ5007, and the dotted line shows the Hβ position. The red shaded region denotes the wavelength range over which the residual [Oiii]λ5007 emission has been integrated to produce the maps shown on the right. Right panels: residual maps obtained by collapsing the spectral channels corresponding to the residual [Oiii]λ5007 emission, as shown by the red region in the left panels. In the first five maps the clear [Oiii]λ5007 residual emission suggests that the emitting region is spatially resolved. The “noise” residual map of HE0251 indicates that the sources are not resolved.
Current usage metrics show cumulative count of Article Views (full-text article views including HTML views, PDF and ePub downloads, according to the available data) and Abstracts Views on Vision4Press platform.
Data correspond to usage on the plateform after 2015. The current usage metrics is available 48-96 hours after online publication and is updated daily on week days.
Initial download of the metrics may take a while.