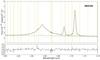
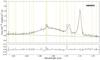
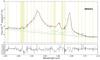
Fig. 1
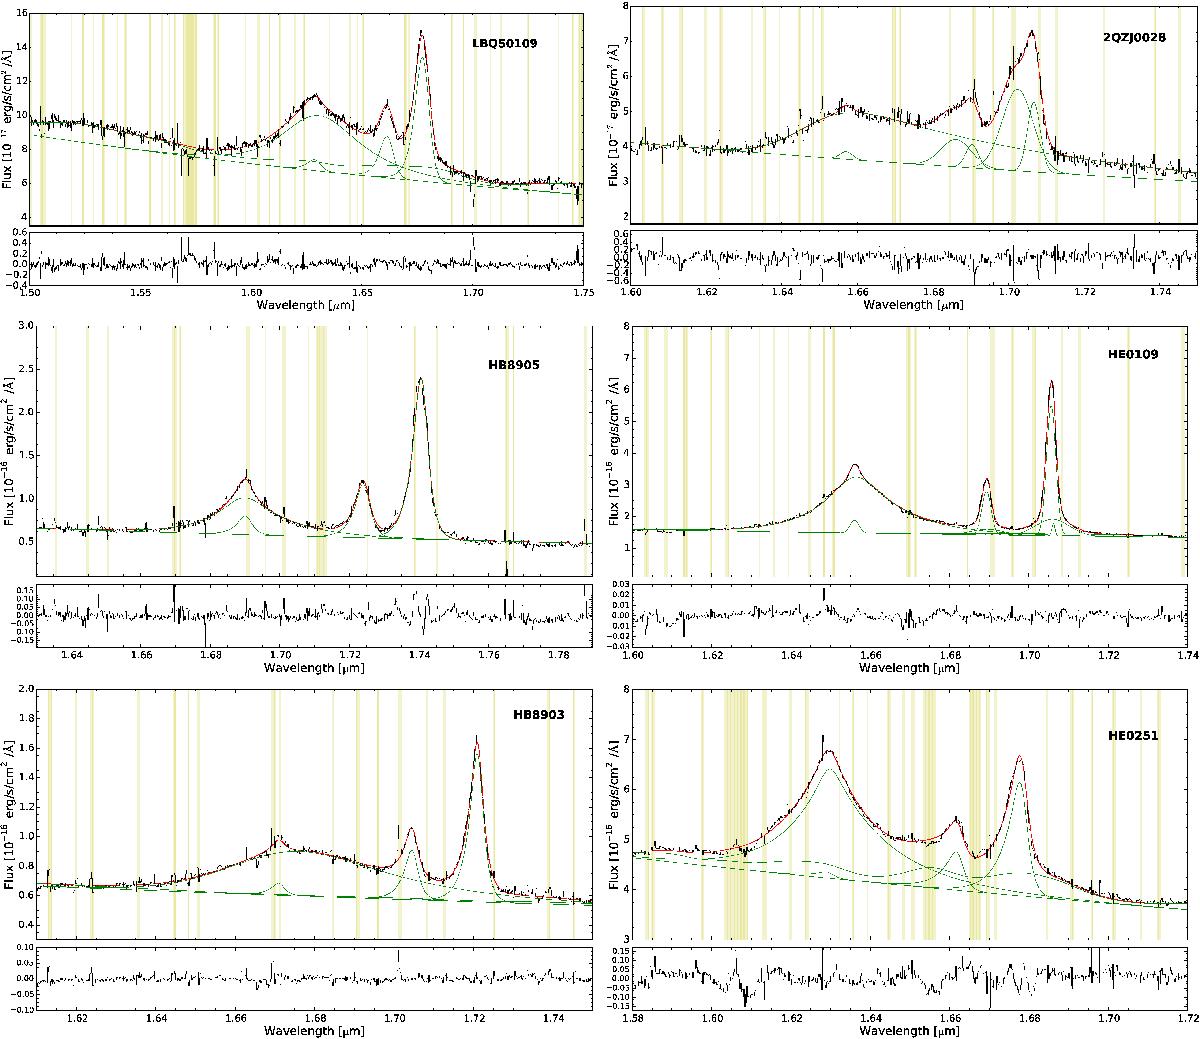
Upper panel: spectra of the six QSOs if our sample. Each spectrum is extracted from a nuclear region of 0.25′′× 025′′ (2 × 2 pixel). The different components in the fit for each line (Hβ, [Oiii] and FeII) are shown in green, and the red line is the total fit. The shaded yellow regions indicate the zone affected by strong sky-line residuals that are excluded from the fit. Lower panel: fit residuals, obtained as a difference between observed and model spectra.
Current usage metrics show cumulative count of Article Views (full-text article views including HTML views, PDF and ePub downloads, according to the available data) and Abstracts Views on Vision4Press platform.
Data correspond to usage on the plateform after 2015. The current usage metrics is available 48-96 hours after online publication and is updated daily on week days.
Initial download of the metrics may take a while.