Fig. 2
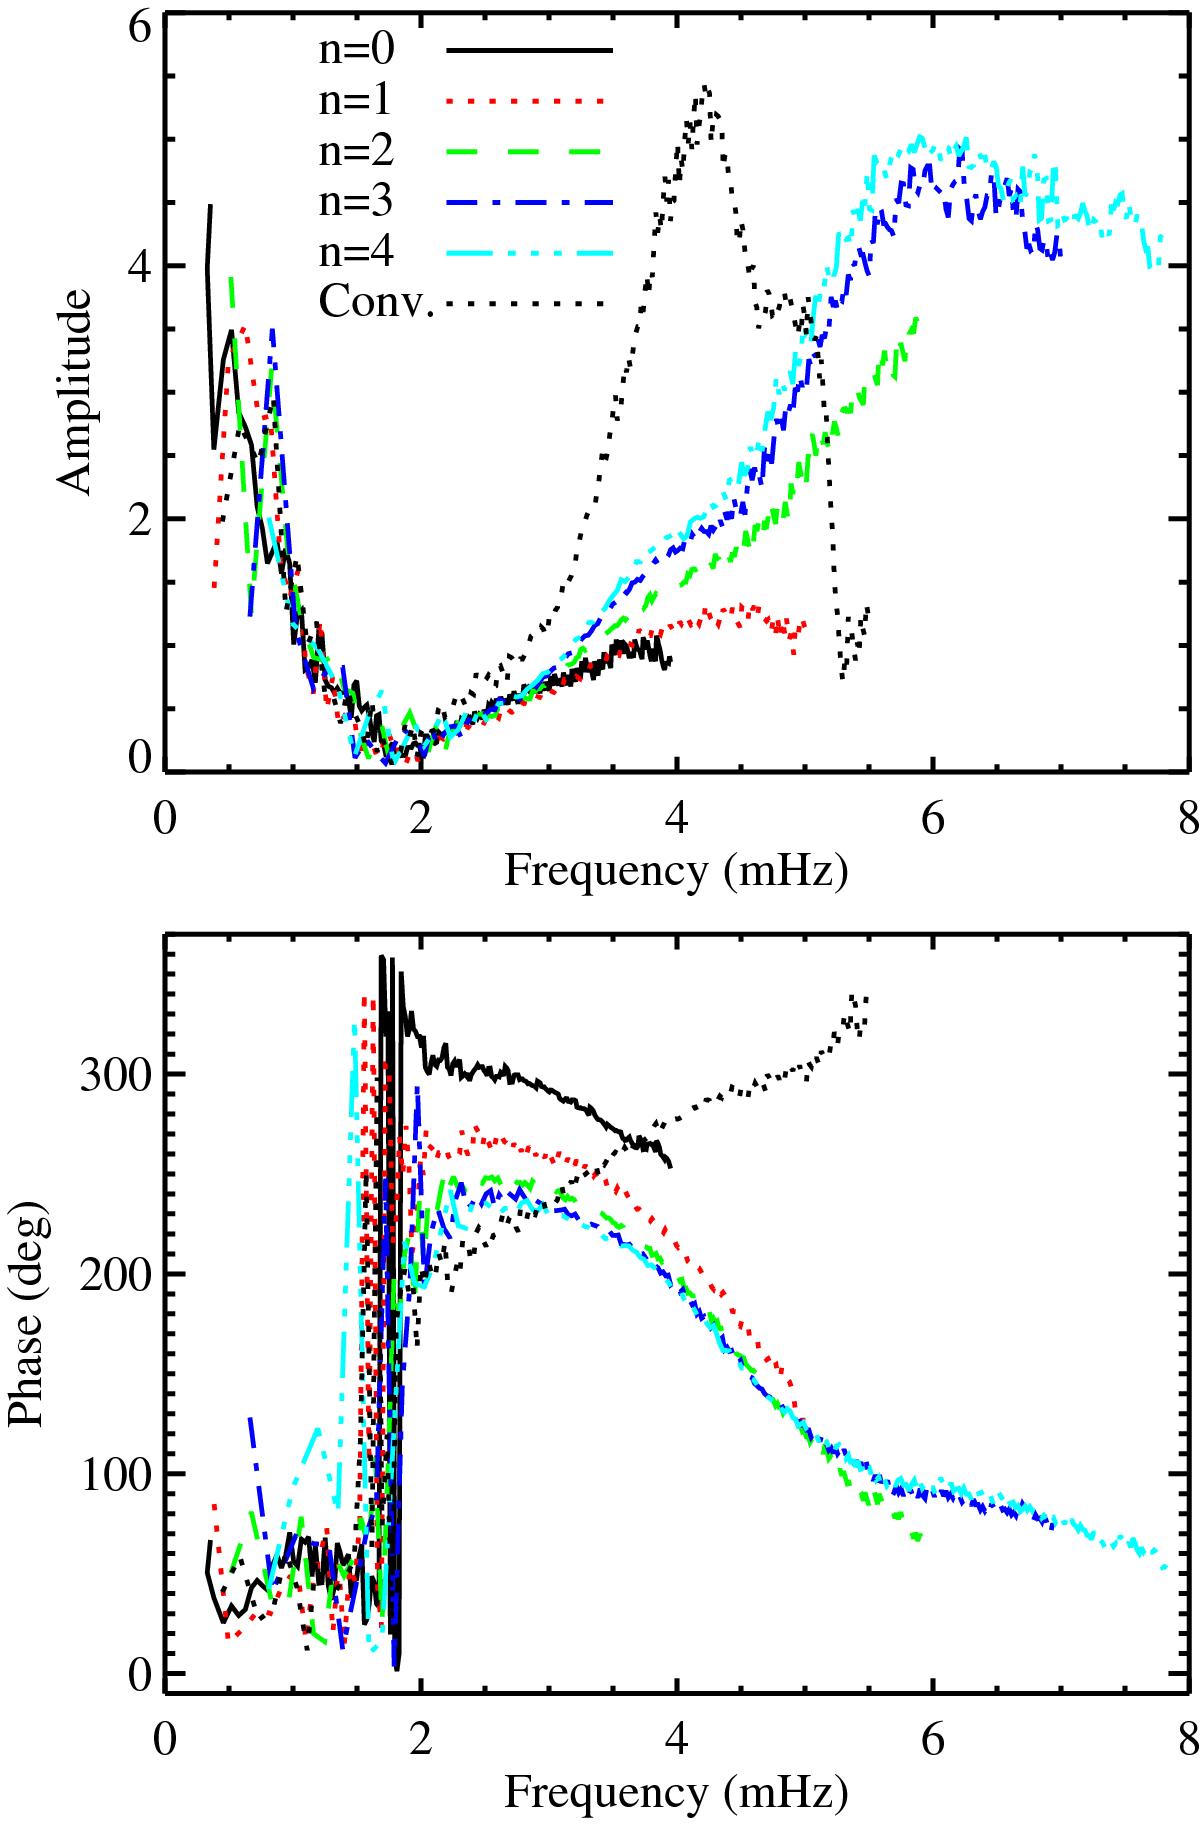
Cuts through panels b) and c) of Fig. 1 along the ridges for n = 0 through 4. Dotted black line shows the results for the noise evaluated half way between the n = 1 and n = 2 ridges. For the phase convention see the caption to Fig. 1. Note that the large oscillations in the phase just below 2 mHz are caused by the very low amplitude in that region and thus large noise sensitivity. This, in turn, also results in problems trying to unwrap the phase, which might otherwise have improved the presentation.
Current usage metrics show cumulative count of Article Views (full-text article views including HTML views, PDF and ePub downloads, according to the available data) and Abstracts Views on Vision4Press platform.
Data correspond to usage on the plateform after 2015. The current usage metrics is available 48-96 hours after online publication and is updated daily on week days.
Initial download of the metrics may take a while.