Fig. 6
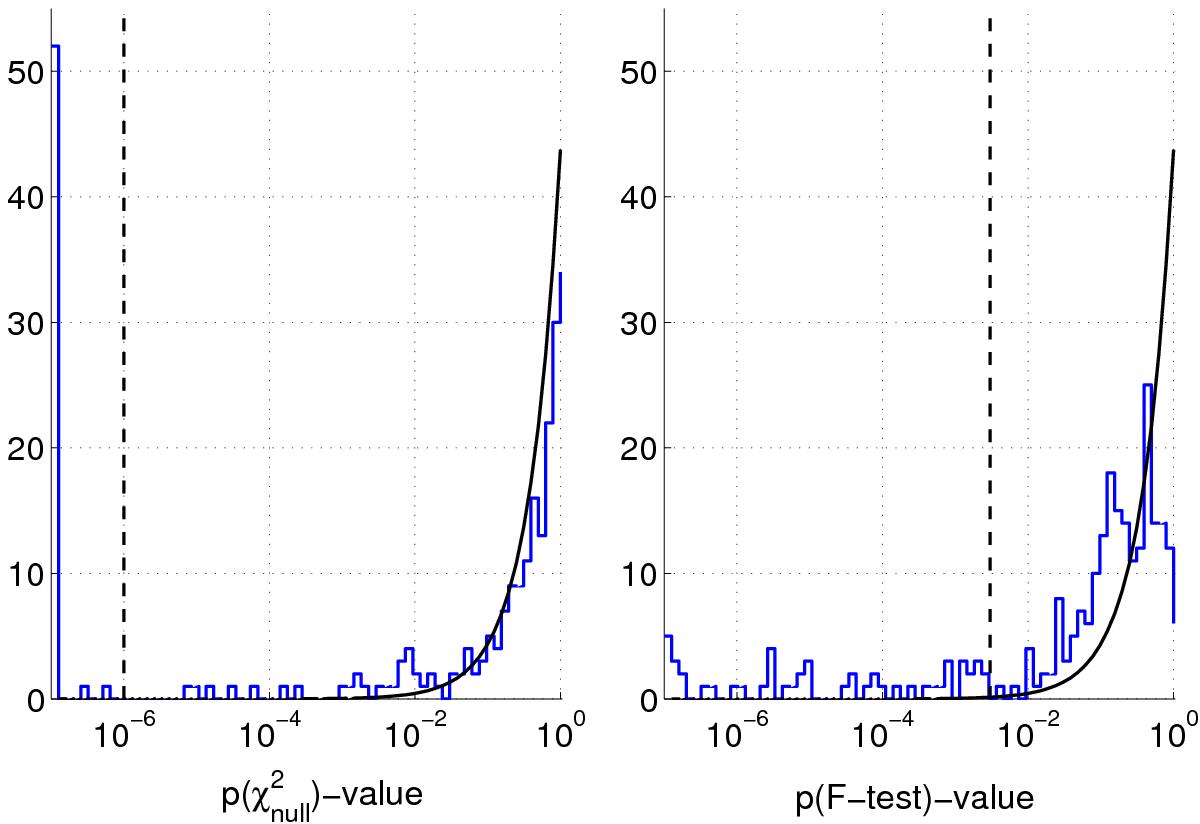
Test statistics p-value histograms of the 255 non-composite spectrum BEER candidates, solving for their red-arm AAOmega RVs. The solid black lines represent a flat distribution between 0 and 1 scaled so that its integral is equal the number of FAs. The dashed black lines mark the critical values that were chosen to separate possible BEER SB1s (to the left of the lines) from FAs (to the right of the lines). The histograms were truncated at 10-7, so that the leftmost columns contain all candidates with p-values < 10-7.
Current usage metrics show cumulative count of Article Views (full-text article views including HTML views, PDF and ePub downloads, according to the available data) and Abstracts Views on Vision4Press platform.
Data correspond to usage on the plateform after 2015. The current usage metrics is available 48-96 hours after online publication and is updated daily on week days.
Initial download of the metrics may take a while.