Free Access
Fig. 4
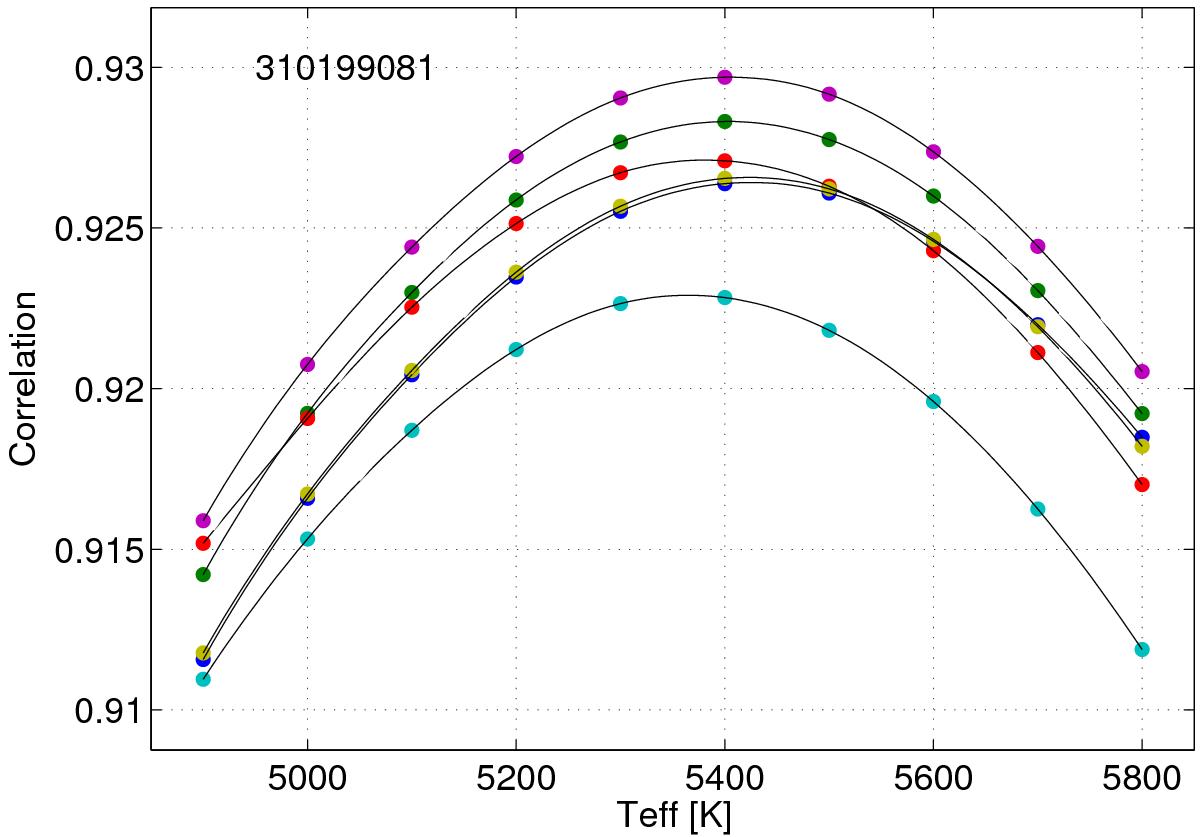
Teff optimization plot of CoRoT 310199081. Colored dots show the maximum-CCF values, cross-correlating its red-arm AAOmega spectra with synthetic Phoenix spectra of different Teff. Solid black lines show for each exposure a SPLINE interpolation of its maximum-CCF versus Teff curve.
Current usage metrics show cumulative count of Article Views (full-text article views including HTML views, PDF and ePub downloads, according to the available data) and Abstracts Views on Vision4Press platform.
Data correspond to usage on the plateform after 2015. The current usage metrics is available 48-96 hours after online publication and is updated daily on week days.
Initial download of the metrics may take a while.