Fig. 3
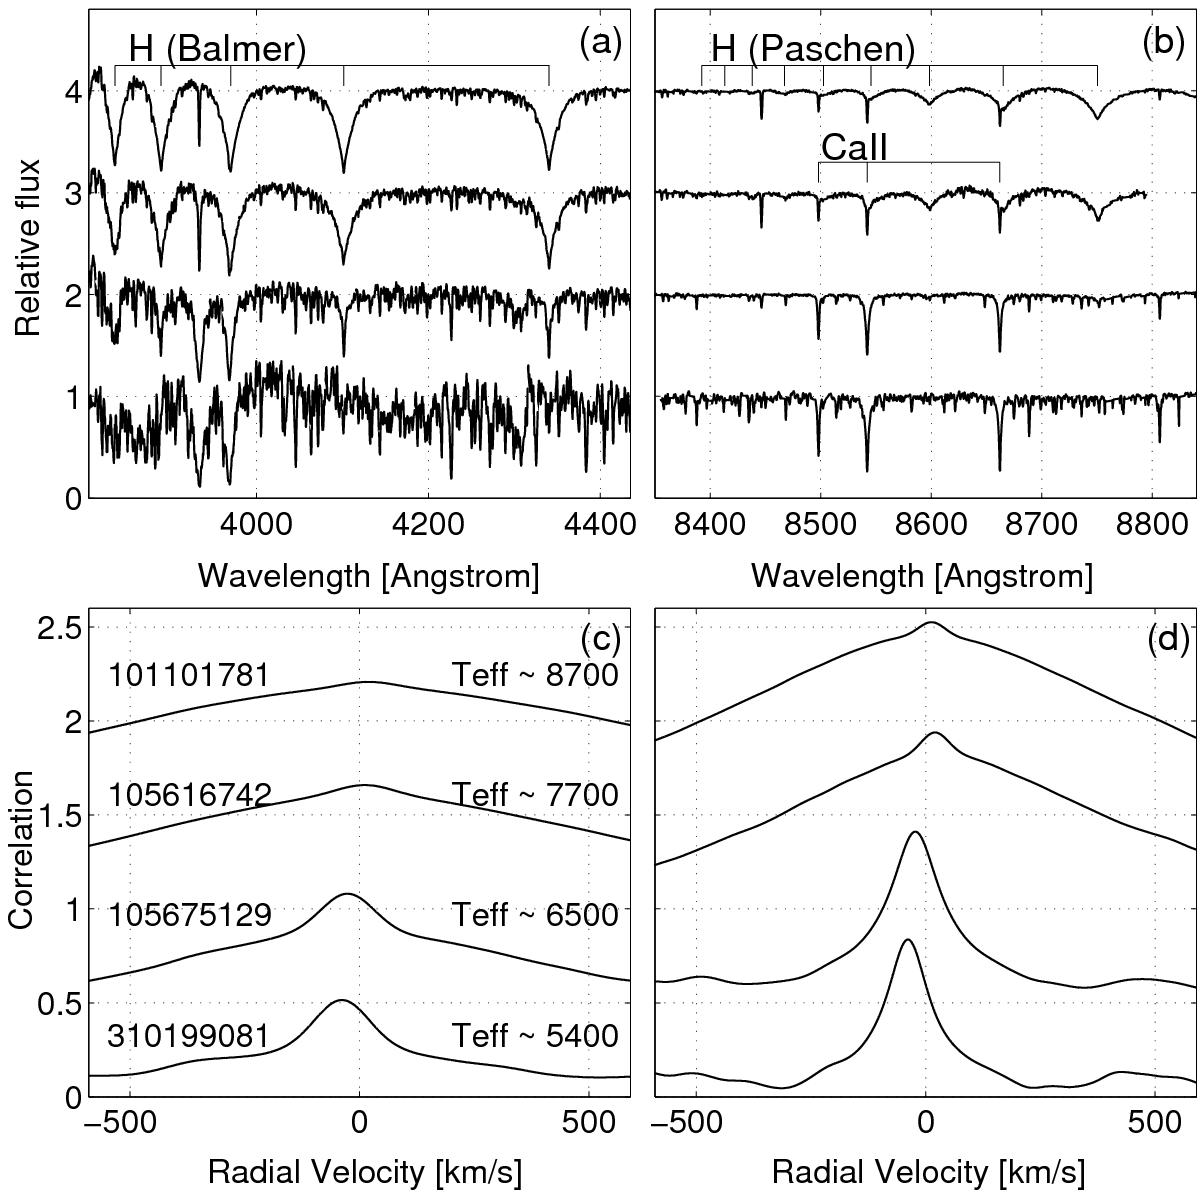
Co-added AAOmega spectra (panels a) and b)) and CCFs (panels c) and d)) of four BEER candidates with different effective temperatures. For clarity, successive spectra were shifted upward by 1 and successive CCFs were shifted upward by 0.55. CoRoT IDs and estimated temperatures of the four candidates are indicated in panel c). Blue-arm spectra and their CCFs are shown on the left (panels a) and c)), while red-arm spectra and their CCFs are shown on the right (panels b) and d)). Wavelengths of Ca II and hydrogen lines are taken from Kramida et al. (2013).
Current usage metrics show cumulative count of Article Views (full-text article views including HTML views, PDF and ePub downloads, according to the available data) and Abstracts Views on Vision4Press platform.
Data correspond to usage on the plateform after 2015. The current usage metrics is available 48-96 hours after online publication and is updated daily on week days.
Initial download of the metrics may take a while.