Fig. 10
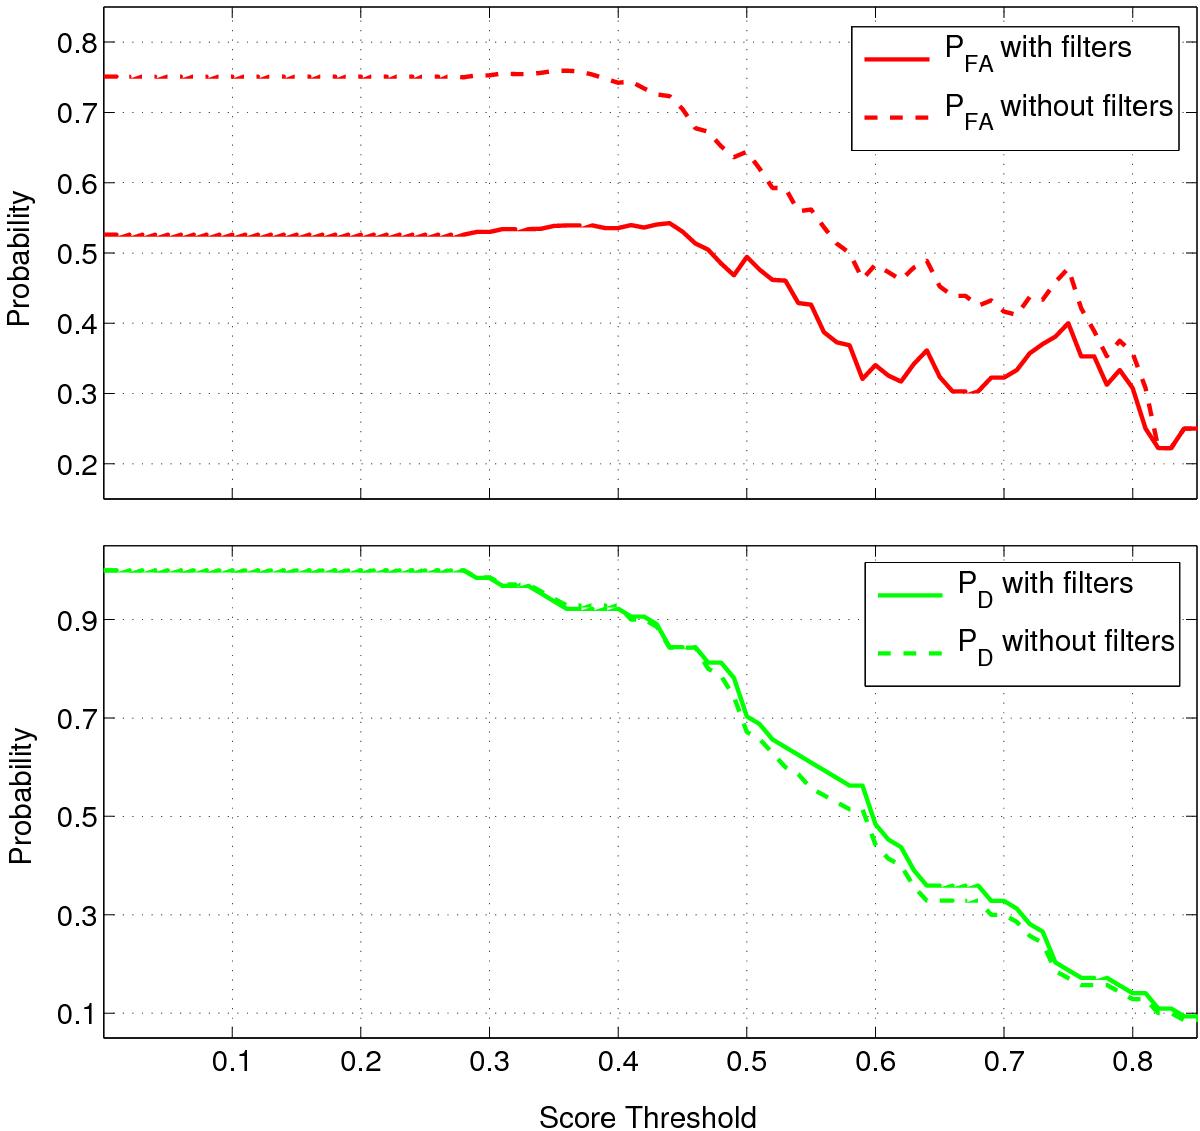
Upper panel: false-alarm probability as a function of the BEER score threshold. Lower panel: the detection probability as a function of the BEER score threshold. The dashed lines show the probabilities for the whole sample of 281 candidates observed, while the solid lines show the probabilities for the remaining 135 candidates, after applying the three filters discussed in the text (see also the first two rows of the right-hand side of Table 9). The plot was truncated at a score threshold of 0.85 since only 8 candidates got a higher score.
Current usage metrics show cumulative count of Article Views (full-text article views including HTML views, PDF and ePub downloads, according to the available data) and Abstracts Views on Vision4Press platform.
Data correspond to usage on the plateform after 2015. The current usage metrics is available 48-96 hours after online publication and is updated daily on week days.
Initial download of the metrics may take a while.