Fig. 1

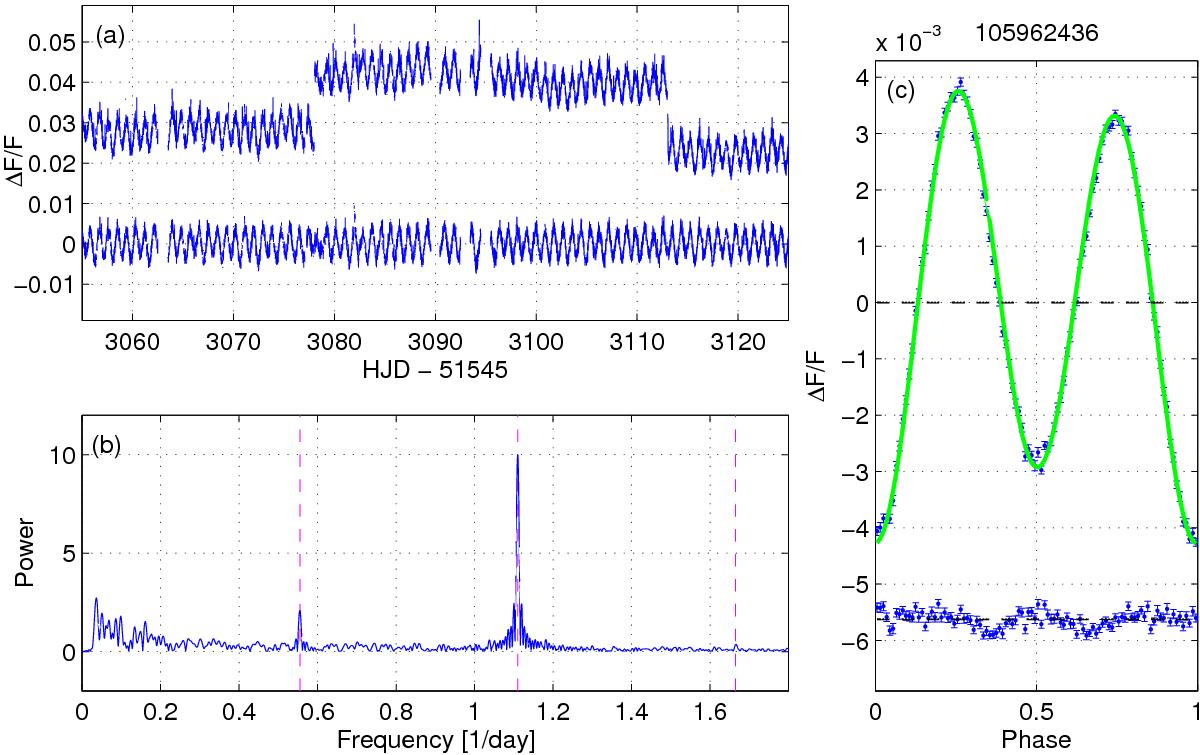
BEER light curve analysis of CoRoT 105962436a) A 70-day long part of the CoRoT white light curve, normalized by its median. For clarity, the original light curve was shifted upward by 0.03 relative to the cleaned and detrended one. The cleaned light curve demonstrates the jumps correction, outlier removal, and detrending functionality. b) FFT-based power spectrum of the detrended light curve, with its maximum value normalized to 10. Vertical dashed lines mark the first three harmonics of the candidate orbital frequency. c) Phase-folded and binned light curve (blue) and the best-fit BEER models assuming a circular orbit (green). The residuals were shifted downward for clarity.
Current usage metrics show cumulative count of Article Views (full-text article views including HTML views, PDF and ePub downloads, according to the available data) and Abstracts Views on Vision4Press platform.
Data correspond to usage on the plateform after 2015. The current usage metrics is available 48-96 hours after online publication and is updated daily on week days.
Initial download of the metrics may take a while.


