| Issue |
A&A
Volume 580, August 2015
|
|
|---|---|---|
| Article Number | A23 | |
| Number of page(s) | 3 | |
| Section | Catalogs and data | |
| DOI | https://doi.org/10.1051/0004-6361/201526413 | |
| Published online | 22 July 2015 | |
A new catalogue of Strömgren-Crawford uvbyβ photometry⋆,⋆⋆
Department of Theoretical Physics and AstrophysicsMasaryk
University,
Kotlářská 2,
611 37
Brno,
Czech Republic
e-mail:
This email address is being protected from spambots. You need JavaScript enabled to view it.
Received: 26 April 2015
Accepted: 31 May 2015
Abstract
Context. The uvbyβ photometric system is widely used for the study of various Galactic and extragalactic objects. It measures the colour due to temperature differences, the Balmer discontinuity, and blanketing absorption due to metals.
Aims. A new all-sky catalogue of all available uvbyβ measurements from the literature was generated.
Methods. The data for the individual stars were cross-checked on the basis of the Tycho-2 catalogue. This catalogue includes very precise celestial coordinates, but is magnitude and spatial resolution limited. However, the loss of objects is only marginal and is compensated for by the gain of homogeneity.
Results. In total, 298 639 measurements of 60 668 stars were used to derive unweighted mean indices and their errors. Photoelectric and CCD observations were treated in the same way.
Conclusions. The presented data set can be used for various applications such as new calibrations of astrophysical parameters, the standardization of new observations, and as additional information for ongoing and forthcoming all-sky surveys.
Key words: catalogs / techniques: photometric
The catalogue is only available at the CDS via anonymous ftp to cdsarc.u-strasbg.fr (130.79.128.5) or via http://cdsarc.u-strasbg.fr/viz-bin/qcat?J/A+A/580/A23
© ESO, 2015
1. Introduction
One of the most successful and powerful astronomical photometric systems is uvbyβ introduced by Bengt Strömgren (Strömgren 1956, 1966) and extended by David Crawford (Crawford 1958). It was mainly designed to investigate stars and their basic astrophysical characteristics in an acurate way. It measures the effective temperature, the Balmer discontinuity, and blanketing due to metallic lines. Furthermore, it can be used to estimate the interstellar extinction and reddening. Several reddening-free indices for many different purposes and spectral type regions have been developed so far. In addition, some very successful extensions have been developed such as the Δa (Paunzen et al. 2005) and Stromvil (Straizys 1996, 1999) systems.
More than two dozen papers have been dedicated to the calibration of stellar astrophysical parameters of objects across the complete Hertzsprung-Russell diagram (HRD; e.g. Olsen 1988; Gray 1992).
It was also used, for example, to investigate both open and globular clusters (Beaver et al. 2013; Calamida et al. 2014), the stellar population in the Magellanic Clouds (Livanou et al. 2013), and the ages of early-type galaxies (Rakos et al. 2008). These are just a few of the applications of this photometric system. Recently, Wang et al. (2014) announced a new all-sky uvbyβ survey to a completeness limit of about 19th magnitude on the basis of one-metre class telescopes.
In order to prepare the grounds for new astrophysical calibrations, and also to supplement spectroscopic, photometric, and kinematic surveys such as Gaia (Jofré et al. 2014), LAMOST (Li et al. 2015), and RAVE (Piffl et al. 2014), it is essential to have a homogeneous set of mean uvbyβ photometry. Starting with Lindeman & Hauck (1973), a continuous update of the available photoelectric measurements were compiled until the last version by Hauck & Mermilliod (1998) at the Institut d’Astronomie de l’Université de Lausanne (Switzerland). Since then, no efforts have been made to also include CCD data into this compilation.
In this paper, a new catalogue of the published and available uvbyβ measurements, through to the end of 2014, is presented. It builds upon the data set published by Hauck & Mermilliod (1998). It includes photoelectric as well as CCD data. The cross reference of the objects has been done using the positional data of the Tycho-2 catalogue (Høg et al. 2000). Such a procedure is especially important for close binary systems, high proper motion stars, and objects in dense star cluster fields. In total, 298 639 data points were used to get the final mean values for 60 668 stars with −1.09 <VT< + 14.05 mag. However, about 98% stars are between 4th and 12th magnitude.
2. Sample selection and analysis
The Tycho-2 catalogue (Høg et al. 2000) and its two supplements were used as the basis to identify and cross-reference the stars and their measurements. The catalogue provides celestial positions, proper motions, and two-colour photometric data for about 2 550 000 stars. Components of binaries with separations down to 0.8′′ are included. The catalogue is about 90% complete to magnitudes of V ~ 11.5 mag with the faintest objects around the 15th magnitude. Only objects included in the Tycho-2 catalogue were considered in the following. With that constraint very close binary systems, fainter objects, and stars in very dense fields (star clusters) are not incorporated, but possible false identifications are minimized.
The starting point for the compilation of the available uvbyβ data was the catalogue by Hauck & Mermilliod (1998), which includes only photoelectric measurements. It contains 105 873 individual measurements of 63 313 stars without an a priori magnitude limitation. Since then, regular updates until 2007 were incorporated in the General Catalogue of Photometric Data (GCPD, Mermilliod et al. 1997). However, the most recent version is not available in a compiled form and does not include any CCD observations. For the new catalogue, the literature though the end of 2014 was searched for photoelectric and CCD uvbyβ measurements.
The weighting procedure and calculation of the means by Hauck & Mermilliod (1998) was not duplicated here. They introduced a two-step iterative procedure, where the first step consists of a simple weighted mean, the weight being the number of measurements to the 2/3 power and a publication weight. The latter are individual heuristic weights between zero and four for each publication depending on the quality of the data (for example, known offsets). The second step uses the differences of the individual values to the mean to compute the final weighted mean values. The main reasons why this procedure was not applied is that a) most authors are no longer listing the actual number of individual measurements/frames/images and b) there is no objective way to derive the publication weight. The comparison of the internal accuracy of CCDs to photoelectric measurements and the reliability of standardization procedures has often been discussed (Bessell 2005). In particular, the found differences in the blue wavelength region (u filter) make a comprehensive weighting complicated.
A simple averaging, without weighting, of all individual measurements for one single star was applied and the standard deviation of the mean calculated. For only one available data point either its error from the corresponding reference or no value is listed.
Number of individual measurements for each index, the number of objects, and the mean of the standard deviation.
The unique numbering system of Hauck & Mermilliod (1998) was not continued. Its designation “uvby98” is followed by eight digits, which is based on the identification according to the Geneva seven-colour photometric system (Rufener 1988). It is based on a hierarchical system of secondary catalogues and numbering systems. There are special codes for members of clusters, associations, different kind of stars (for example, faint blue stars, white dwarfs, and emission-line stars), and common acronyms. Since the new compilation is based on the Tycho-2 catalogue, those numbers together with celestial coordinates, are used as identifiers. Several cross identification of the Tycho-2 catalogue with other sources are available in the literature (e.g. Fabricius et al. 2002).
Table 1 lists the number of individual measurements for the four indices. In total, 298 639 data points were used to get the final mean values. This is almost a factor of three more than in the catalogue by Hauck & Mermilliod (1998).
The final catalogue includes the four mean observables (b − y), m1, c1, and β, their standard deviations, the number of individual measurements, and the complete information of the Tycho-2 catalogue. A separate file will also be provided in the VizieR database and a mirror of the GCPD1, which includes all individual measurements and the references.
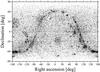 |
Fig. 1 Distribution of the 60 668 catalogue stars on the sky. |
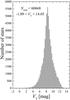 |
Fig. 2 VT distribution of the 60 668 catalogue stars. |
3. Results and outlook
The final catalogue represents a sample of stars distributed over the whole sky as shown in Fig. 1. Several very important Galactic features such as the disk and the north and south poles are seen. There is a belt of stars visible at zero declination, which is due to many standard stars measured in this region being accessible from both the northern and southern hemispheres.
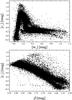 |
Fig. 3 [c1] versus [m1] (upper panel) and [c1] versus β (lower panel) diagrams for the catalogue stars. |
The distribution of the VT magnitudes of the catalogue stars is shown in Fig. 2. The transformation to Johnson V can be done by taking in account a colour term with a factor of 0.09, and an additional correction δV. The latter reaches not more than 0.05 mag (Kharchenko 2001). The catalogue includes stars from which 98% are in the magnitude range of 4.0 <VT< 12.0 mag, with a peak at about 8.5 mag.
One of the most severe complications when using photometric indices for calibrating and estimating stellar parameters is the interstellar extinction. Depending on the Galactic location and the location of dust and gas clouds, it could reach up to 4.0 mag kpc-1 (Chen et al. 2014). Therefore, even in the early history of the photometric systems, researchers looked for a feasible work around. While it normally only works for hot stars in broadband photometric systems, such as Johnson UBV or 2MASS JHKS, Strömgren (1966) already suggested using the reddening independent indices [m1], [c1], and β.
The [m1] index measures the depression due to metal lines around 4100 Å (metallicity), [c1] measures the Balmer jump (luminosity), and β measures the strength of the Hβ line (effective temperature). Depending on the spectral region, these indices could also be slightly sensitive to other parameters than the listed basic astrophysical ones (Strömgren 1966; Golay 1974).
For the calculation of the reddening-free parameters [m1] and [c1], the coefficients by Crawford & Mandwewala (1976) were used:
![Mathematical equation: \begin{eqnarray} &&\left[m_{\mathrm 1}\right] = m_{\mathrm 1} + 0.33\left(b-y\right) \\ &&\left[c_{\mathrm 1}\right] = c_{\mathrm 1} - 0.20\left(b-y\right) . \end{eqnarray}](/articles/aa/full_html/2015/08/aa26413-15/aa26413-15-eq23.png)
Figure 3 shows the [c1] versus [m1] and [c1] versus β diagrams for the stars included in the catalogue. In the upper panel the main-sequence band with the bifurcation of the giants is clearly visible. The hot supergiants are located above the main-sequence at [m1] = 0.2 mag. The clump of low-metallicity stars, i.e. intermediate Population I and true Population II objects, is located around [c1] = [m1] = 0.2 mag. The lower panel shows the main-sequence of stars with the bifurcation of cool giants. As in the former diagram, supergiants are above the main sequence, whereas subdwarfs and binary stars are below it.
This new data set can be used for new calibrations of astrophysical parameters and also for the standardization of new observations and as additional information for ongoing as well as forthcoming all-sky surveys.
Acknowledgments
This project is financed by the SoMoPro II programme (3SGA5916). The research leading to these results has acquired a financial grant from the People Programme (Marie Curie action) of the Seventh Framework Programme of the EU according to the REA Grant Agreement No. 291782. The research is further co-financed by the South-Moravian Region. This work reflects only the authors’ views, and the European Union is not liable for any use that may be made of the information contained therein. It was also supported by the grant 7AMB14AT015 and the financial contributions of the Austrian Agency for International Cooperation in Education and Research (BG-03/2013 and CZ-09/2014). This research has made use of the WEBDA database, operated at the Department of Theoretical Physics and Astrophysics of the Masaryk University. This paper is dedicated to Roswitha Müller who died during its preparation.
References
- Beaver, J., Kaltcheva, N., Briley, M., & Piehl, D. 2013, PASP, 125, 1412 [NASA ADS] [CrossRef] [Google Scholar]
- Bessell, M. S. 2005, ARA&A, 43, 293 [NASA ADS] [CrossRef] [Google Scholar]
- Calamida, A., Bono, G., Lagioia, E. P., et al. 2014, A&A, 565, A8 [NASA ADS] [CrossRef] [EDP Sciences] [Google Scholar]
- Chen, B.-Q., Liu, X.-W., Yuan, H.-B., et al. 2014, MNRAS, 443, 1192 [NASA ADS] [CrossRef] [Google Scholar]
- Crawford, D. L. 1958, ApJ, 128, 185 [NASA ADS] [CrossRef] [Google Scholar]
- Crawford, D. L., & Mandwewala, N. 1976, PASP, 88, 917 [NASA ADS] [CrossRef] [Google Scholar]
- Fabricius, C., Makarov, V. V., Knude, J., & Wycoff, G. L. 2002, A&A, 386, 709 [NASA ADS] [CrossRef] [EDP Sciences] [Google Scholar]
- Golay, M. 1974, Introduction to astronomical photometry (Dordrecht: D. Reidel Publishing Co.) [Google Scholar]
- Gray, R. O. 1992, A&A, 265, 704 [NASA ADS] [Google Scholar]
- Hauck, B., & Mermilliod, M. 1998, A&AS, 129, 431 [NASA ADS] [CrossRef] [EDP Sciences] [Google Scholar]
- Høg, E., Fabricius, C., Makarov, V. V., et al. 2000, A&A, 355, L27 [NASA ADS] [Google Scholar]
- Jofré, P., Heiter, U., Soubiran, C., et al. 2014, A&A, 564, A133 [NASA ADS] [CrossRef] [EDP Sciences] [Google Scholar]
- Kharchenko, N. V. 2001, Kinematika i Fizika Nebesnykh Tel, 17, 409 [NASA ADS] [Google Scholar]
- Li, H.-N., Zhao, G., Christlieb, N., et al. 2015, ApJ, 798, 110 [NASA ADS] [CrossRef] [Google Scholar]
- Lindeman, E., & Hauck, B. 1973, A&AS, 11, 119 [NASA ADS] [Google Scholar]
- Livanou, E., Dapergolas, A., Kontizas, M., et al. 2013, A&A, 554, A16 [NASA ADS] [CrossRef] [EDP Sciences] [Google Scholar]
- Mermilliod, J.-C., Mermilliod, M., & Hauck, B. 1997, A&AS, 124, 349 [NASA ADS] [CrossRef] [EDP Sciences] [Google Scholar]
- Olsen, E. H. 1988, A&A, 189, 173 [NASA ADS] [Google Scholar]
- Paunzen, E., Stütz, Ch., & Maitzen, H. M., 2005, A&A, 441, 631 [NASA ADS] [CrossRef] [EDP Sciences] [Google Scholar]
- Piffl, T., Binney, J., McMillan, P. J., et al. 2014, MNRAS, 445, 3133 [NASA ADS] [CrossRef] [Google Scholar]
- Rakos, K., Schombert, J., & Odell, A. 2008, ApJ, 677, 1019 [NASA ADS] [CrossRef] [Google Scholar]
- Rufener, F. 1988, Catalogue of stars measured in the Geneva Observatory photometric system, 4th edn. (Sauverny: Observatoire de Genève) [Google Scholar]
- Straizys, V. 1999, Balt. Astron., 8, 109 [Google Scholar]
- Straizys, V., Crawford, D. L., & Philip, A. G. D. 1996, Balt. Astron., 5, 83 [Google Scholar]
- Strömgren, B. 1956, Vistas Astron., 2, 1336 [Google Scholar]
- Strömgren, B. 1966, ARA&A, 4, 433 [NASA ADS] [CrossRef] [Google Scholar]
- Wang, W., Zhao, G., Chen, Y., & Liu, Y. 2014, in Setting the scene for Gaia and LAMOST (San Francisco: ASP), Proc. IAU Symp., 298, 326 [Google Scholar]
All Tables
Number of individual measurements for each index, the number of objects, and the mean of the standard deviation.
All Figures
|
Fig. 1 Distribution of the 60 668 catalogue stars on the sky. |
| In the text | |
|
Fig. 2 VT distribution of the 60 668 catalogue stars. |
| In the text | |
|
Fig. 3 [c1] versus [m1] (upper panel) and [c1] versus β (lower panel) diagrams for the catalogue stars. |
| In the text | |
Current usage metrics show cumulative count of Article Views (full-text article views including HTML views, PDF and ePub downloads, according to the available data) and Abstracts Views on Vision4Press platform.
Data correspond to usage on the plateform after 2015. The current usage metrics is available 48-96 hours after online publication and is updated daily on week days.
Initial download of the metrics may take a while.