Fig. 9
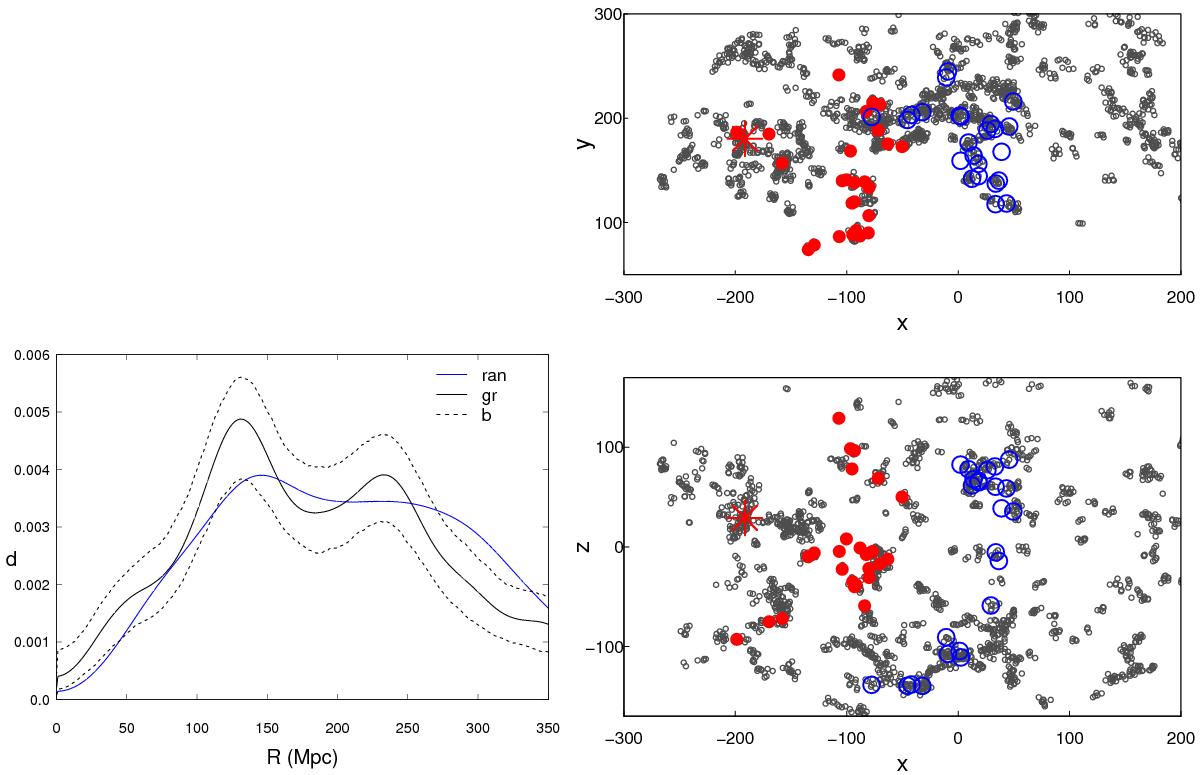
Distribution of distances between cluster A2142 and other groups and clusters with 30 galaxies (left panel), and the distribution of groups with at least four galaxies in x, y, and z coordinates (right panels). Gr denotes group distributions, “ran” the random distribution, and “b” the upper and lower 95% bootstrap confidence limits for the group distributions. In the right panels star shows the location of the cluster A2142, red filled circles denote groups and clusters with at least 30 member galaxies forming the first maximum in the distance distribution, and blue empty circles denote groups and clusters that form the second maximum in the distance distribution. Grey symbols mark the location of other groups and clusters with at least four member galaxies in the region. In the lower right panel the rich system at −100 >xh-1Mpc and z< −100h-1Mpc is the Sloan Great Wall.

Current usage metrics show cumulative count of Article Views (full-text article views including HTML views, PDF and ePub downloads, according to the available data) and Abstracts Views on Vision4Press platform.
Data correspond to usage on the plateform after 2015. The current usage metrics is available 48-96 hours after online publication and is updated daily on week days.
Initial download of the metrics may take a while.