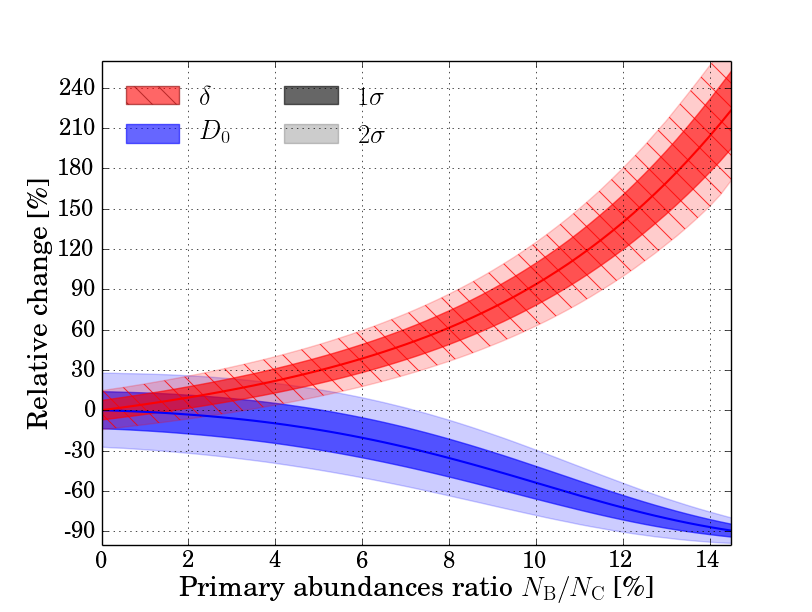
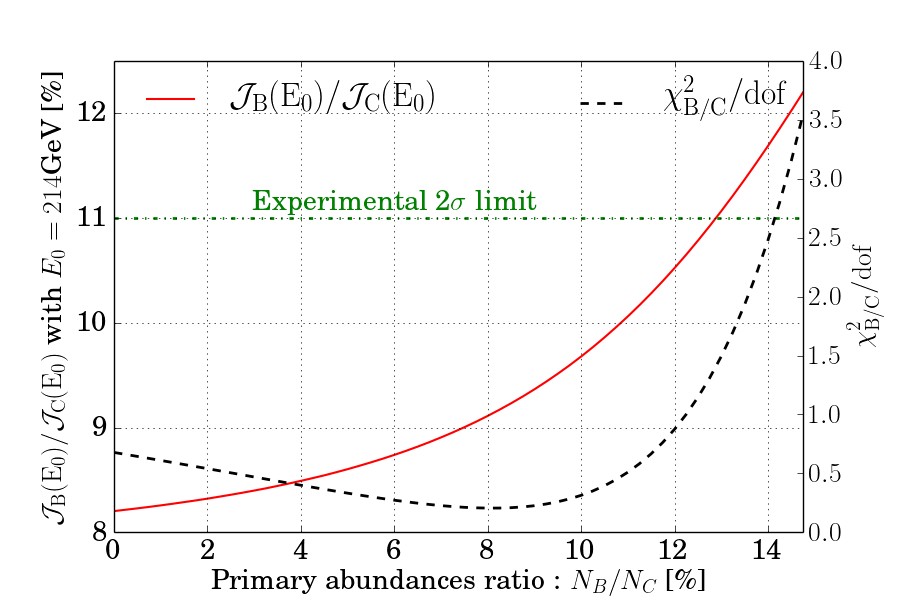
Fig. 5
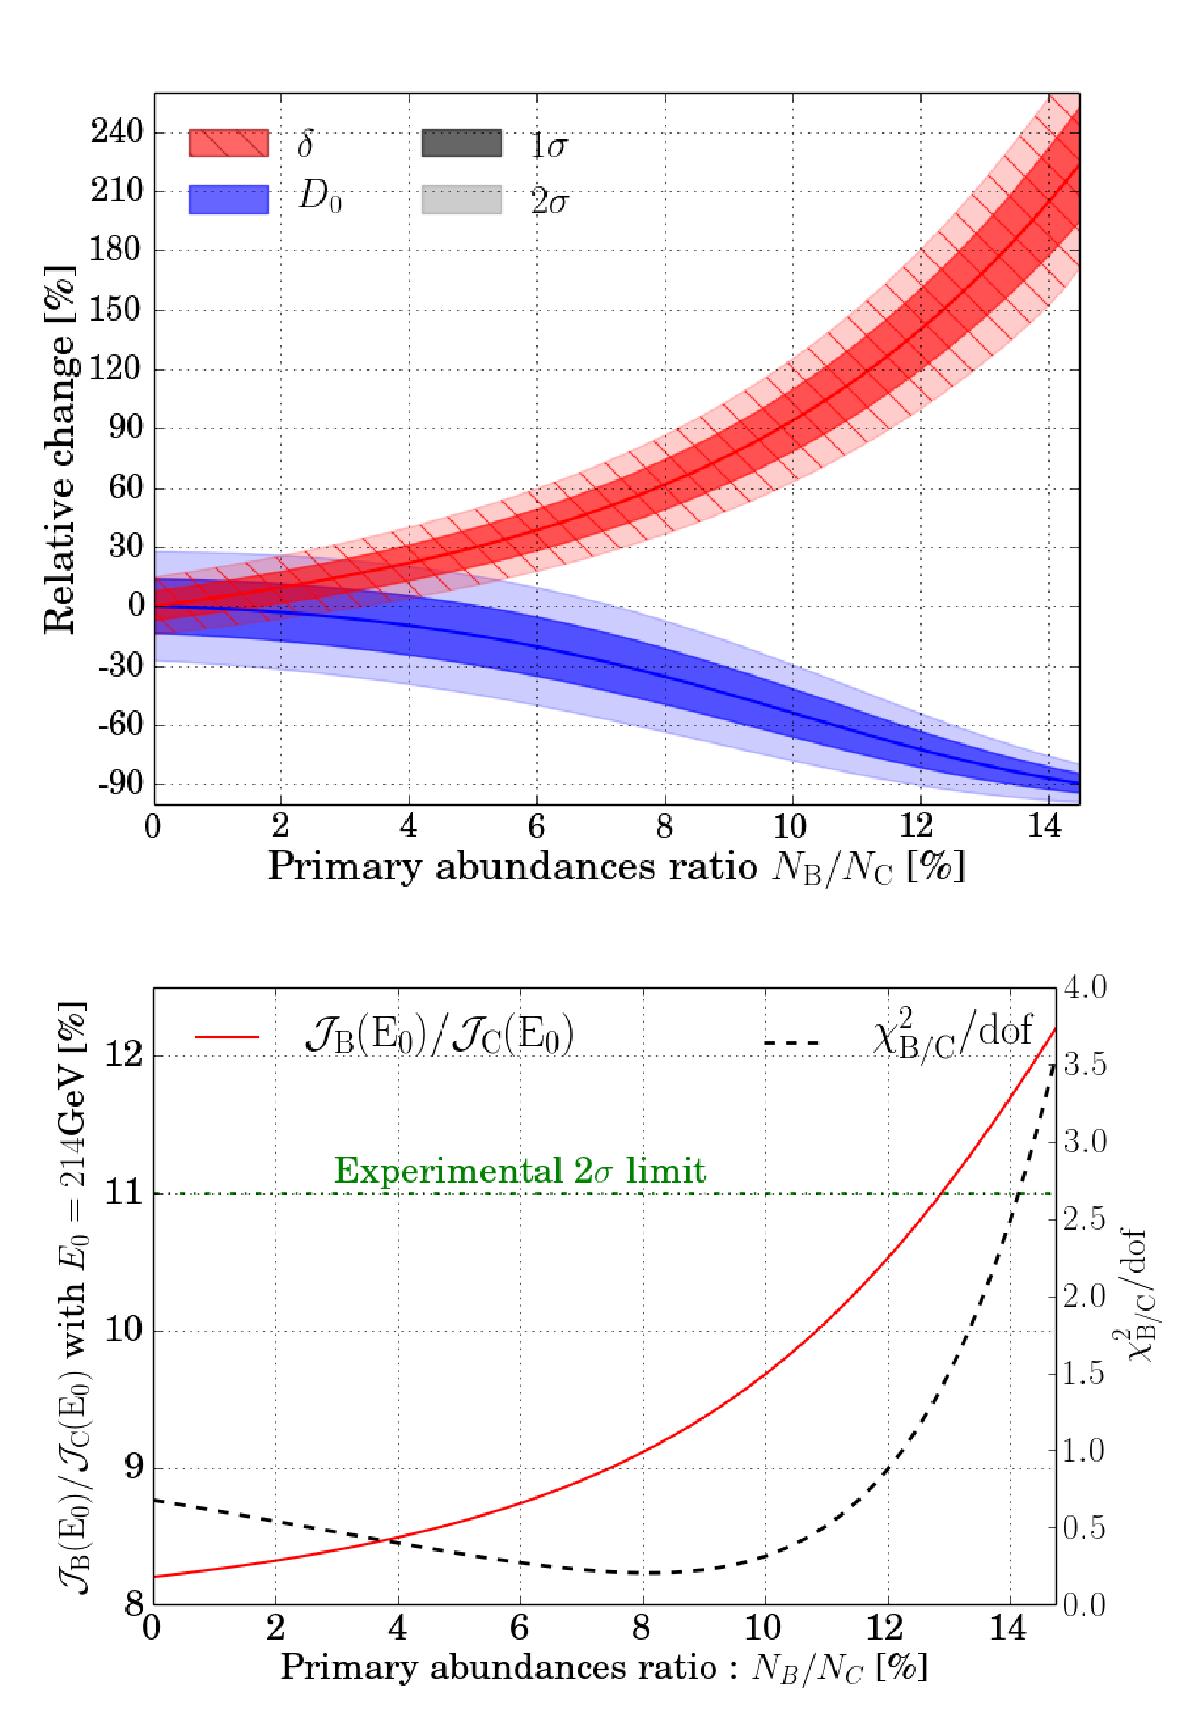
Left panel: variations of the best-fit propagation parameters D0 (blue) and δ (red) relative to the benchmark values of Table 1, as a function of the primary boron-to-carbon injection ratio. The reference model corresponds to the conventional no boron hypothesis for which NB/NC vanishes. Right panel: the theoretical value of the B/C ratio at 214 GeV/nuc (solid red curve) is plotted as a function of the primary boron-to-carbon injection ratio. The dashed black curve indicates the goodness of the B/C fit. As long as NB/NC does not exceed 13%, the theoretical B/C ratio is within 2σ from the AMS-02 measurement (dashed-dotted green curve).

Current usage metrics show cumulative count of Article Views (full-text article views including HTML views, PDF and ePub downloads, according to the available data) and Abstracts Views on Vision4Press platform.
Data correspond to usage on the plateform after 2015. The current usage metrics is available 48-96 hours after online publication and is updated daily on week days.
Initial download of the metrics may take a while.