Fig. 6
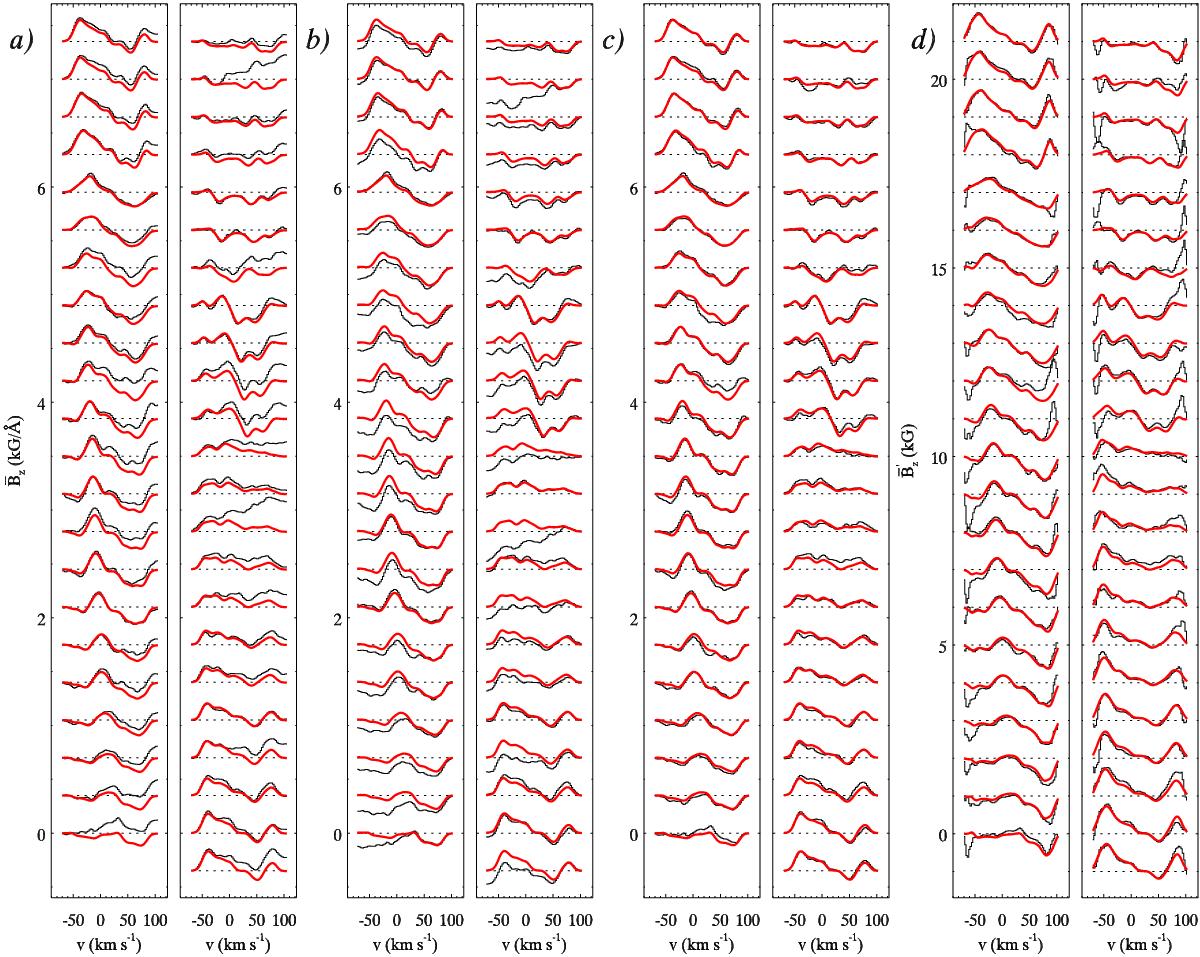
Cumulative Stokes V profiles of V410 Tau computed from the observed (histogram) and theoretical (thick solid line) LSD circular polarisation spectra of V410 Tau shown in Fig. 5. The CSV profiles are shifted vertically according to their rotational phases similar to the Stokes V profiles in Fig. 5. The first three panels show the CSV spectra computed with a) forward integration, b) backward integration, and c) weighted mean of the backward and forward integration. The last panel d) shows the result of converting the CSV profiles in panel c) to the 1−ℛI normalisation according to Eq. (19).
Current usage metrics show cumulative count of Article Views (full-text article views including HTML views, PDF and ePub downloads, according to the available data) and Abstracts Views on Vision4Press platform.
Data correspond to usage on the plateform after 2015. The current usage metrics is available 48-96 hours after online publication and is updated daily on week days.
Initial download of the metrics may take a while.