Fig. 5
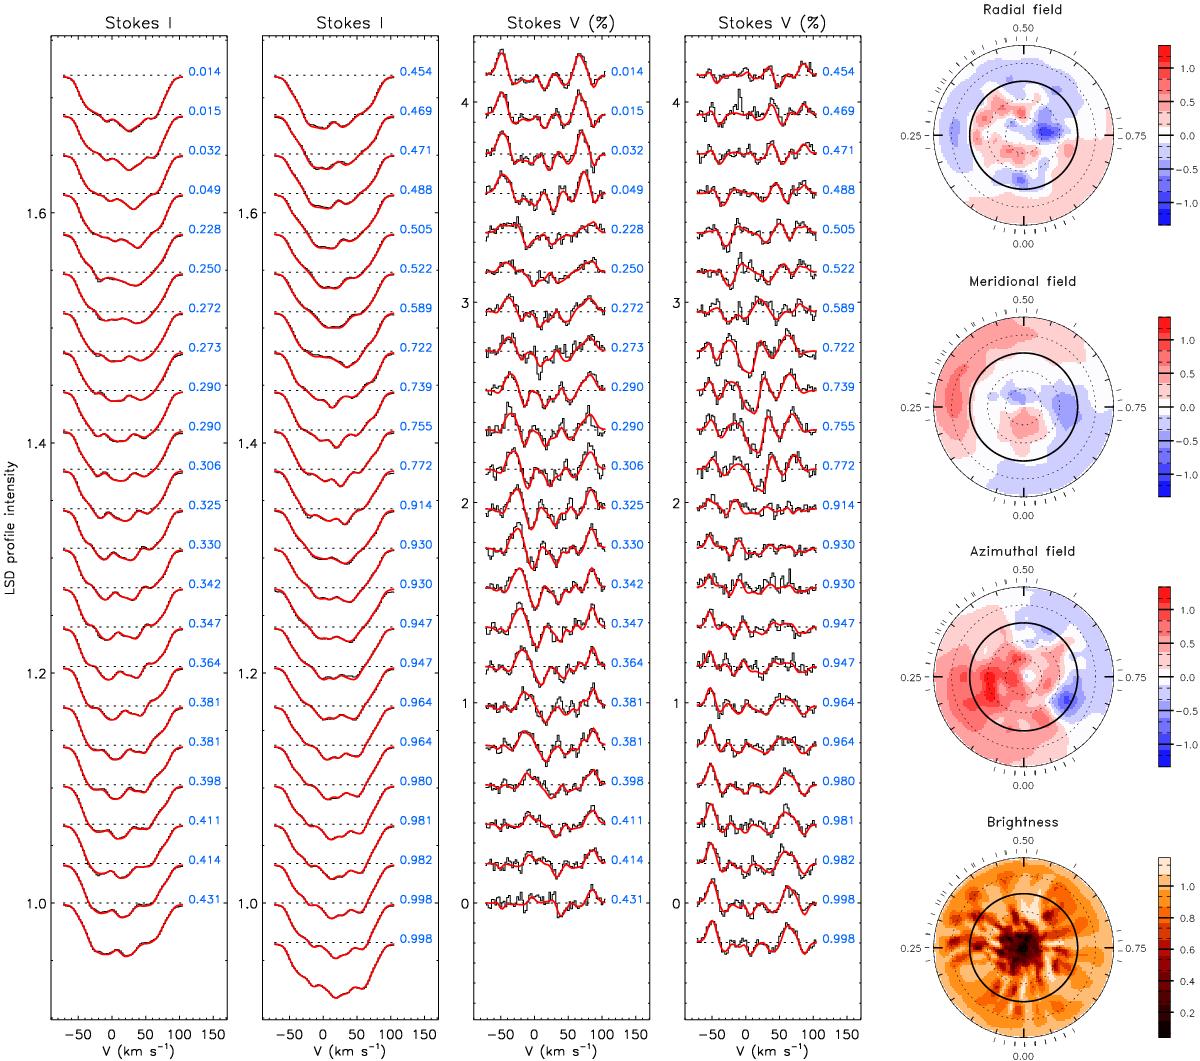
Results of the ZDI analysis of V410 Tau. The four panels on the left side of the figure compare the observed (histogram) and theoretical (solid line) LSD Stokes I and V profiles. In these plots the spectra corresponding to different rotational phases are shifted vertically. The phase is indicated to the right of each profile. Reconstructed maps of the radial, meridional, and azimuthal magnetic field components as well as the brightness distribution are presented in the right column. The star is shown using the flattened polar projection between latitudes −60° and + 90°. The thick circle corresponds to the rotational equator. The colour bars give the field strength in kG and the brightness relative to the photospheric value.
Current usage metrics show cumulative count of Article Views (full-text article views including HTML views, PDF and ePub downloads, according to the available data) and Abstracts Views on Vision4Press platform.
Data correspond to usage on the plateform after 2015. The current usage metrics is available 48-96 hours after online publication and is updated daily on week days.
Initial download of the metrics may take a while.