Fig. 4
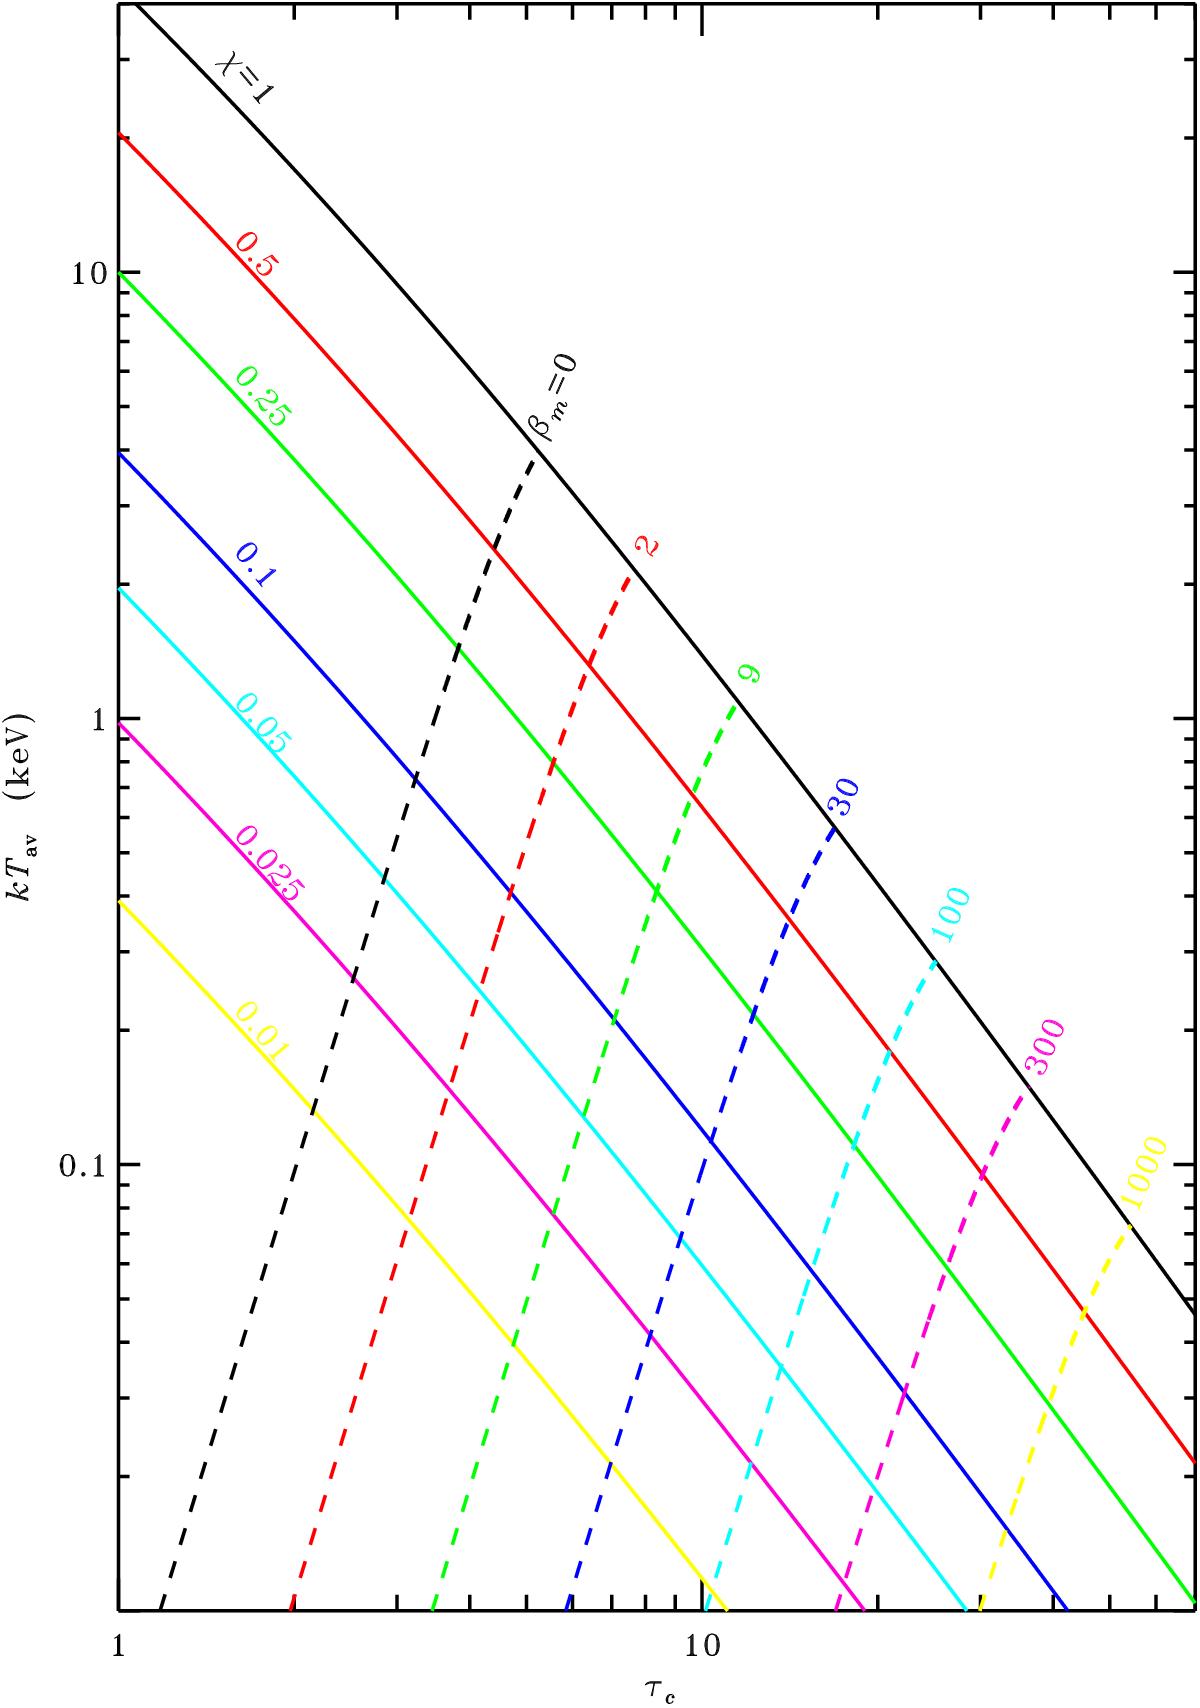
Average coronal temperature vs. optical depth. The full curves show the dependence of the average coronal temperature on the total optical depth of the corona for various values of the fraction of total power dissipated in the corona, χ, as labelled. The dashed curves represent the hydrostatic equilibrium solutions providing the largest possible Thomson depth of the Compton cooled corona for a given χ and magnetic-to-gas-pressure ratio βm (see Sect. 6). Each of the dashed curves shows the track of the solutions in the kTav-τcor plane for a fixed value of βm (as labelled) when χ is varying.
Current usage metrics show cumulative count of Article Views (full-text article views including HTML views, PDF and ePub downloads, according to the available data) and Abstracts Views on Vision4Press platform.
Data correspond to usage on the plateform after 2015. The current usage metrics is available 48-96 hours after online publication and is updated daily on week days.
Initial download of the metrics may take a while.