Fig. 5
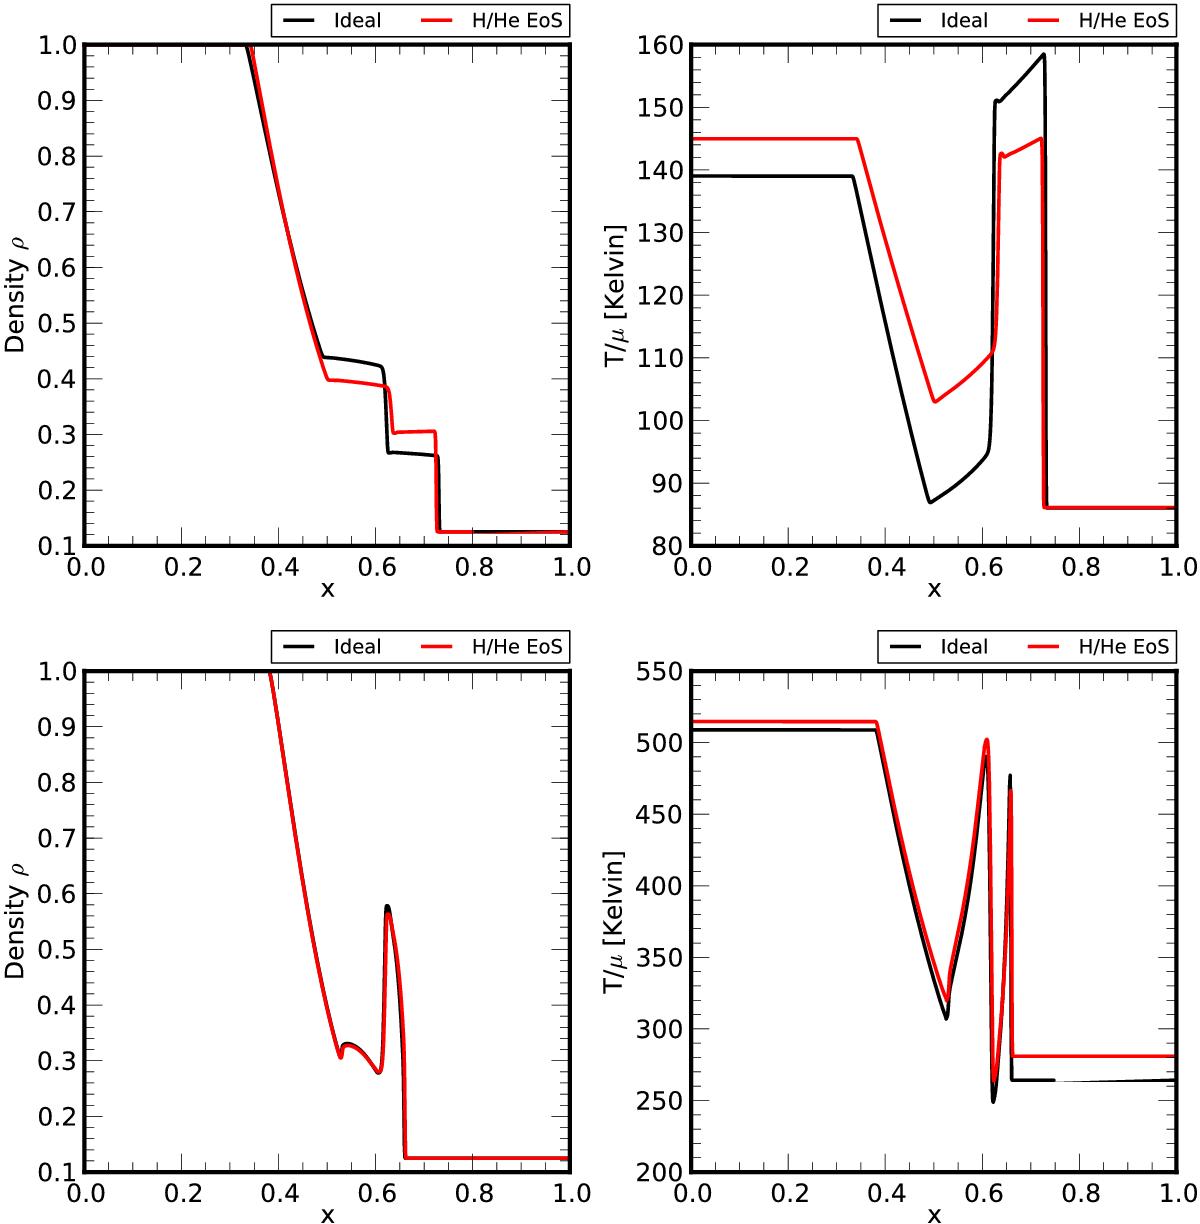
Variation of density (left panels) and temperature (right panels) at the final stage of Sod shock tube test for cases which have included explicit cooling. The black line represent values obtained from ideal EoS, while those obtained using H/He EoS are shown in red. The top and bottom panels differ in the value of their initial temperature on either sides of the interface at x = 0.5.
Current usage metrics show cumulative count of Article Views (full-text article views including HTML views, PDF and ePub downloads, according to the available data) and Abstracts Views on Vision4Press platform.
Data correspond to usage on the plateform after 2015. The current usage metrics is available 48-96 hours after online publication and is updated daily on week days.
Initial download of the metrics may take a while.