Fig. 4
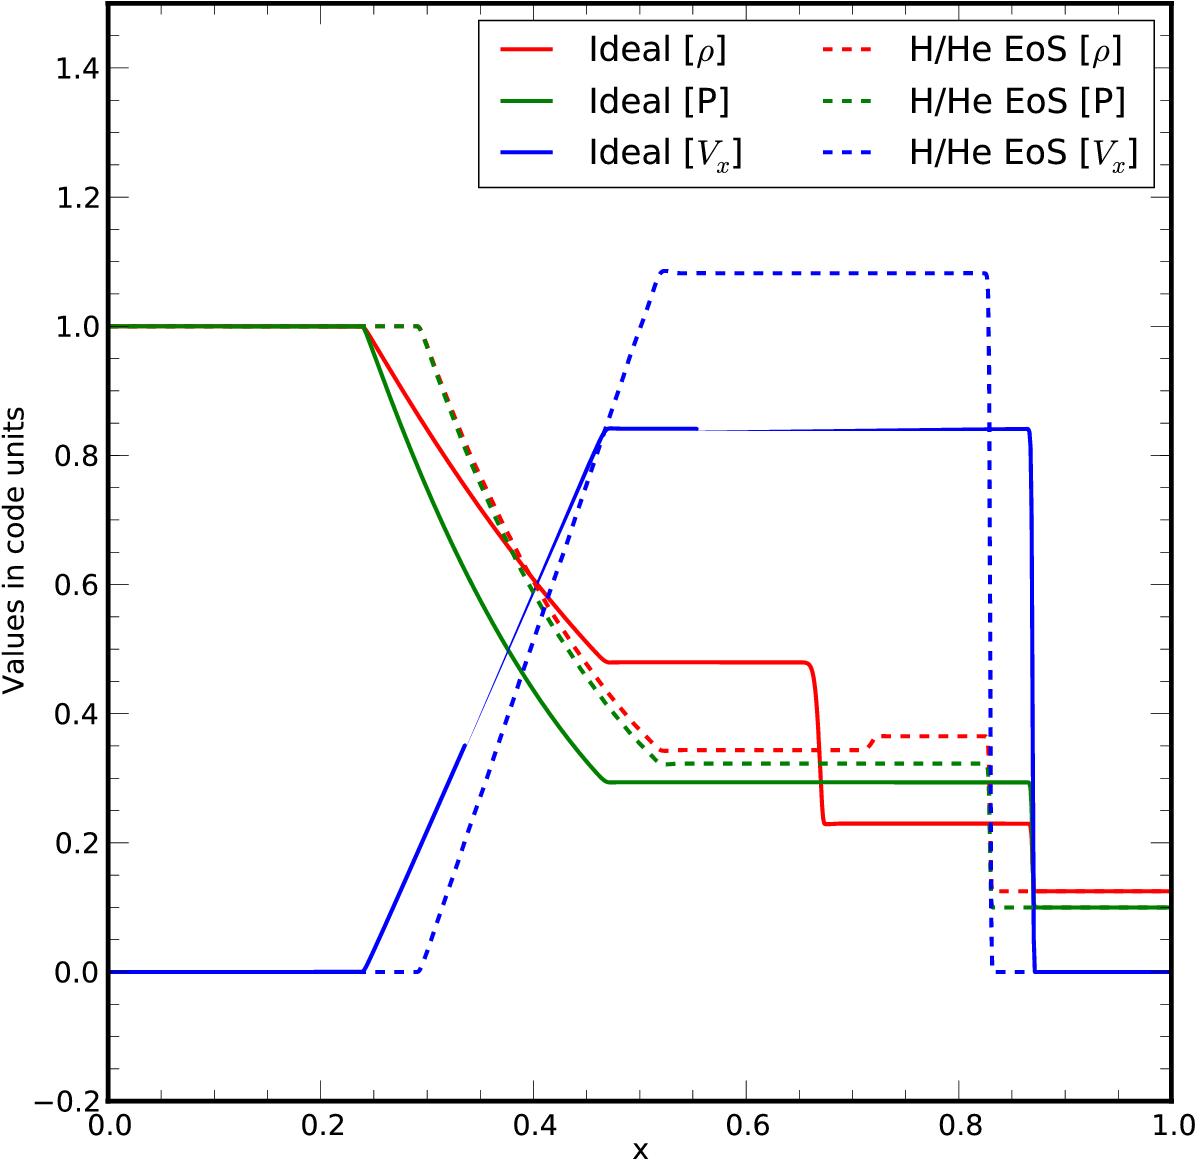
Variation of density ρ (red), pressure P (green), and velocity vx (blue) along the x-axis (in code units) for a standard Sod Tube test (without explicit cooling) at time τ = 0.2. The values obtained using an ideal EoS are shown as solid lines while that obtained using a GammaLaw EoS are shown as dashed lines.
Current usage metrics show cumulative count of Article Views (full-text article views including HTML views, PDF and ePub downloads, according to the available data) and Abstracts Views on Vision4Press platform.
Data correspond to usage on the plateform after 2015. The current usage metrics is available 48-96 hours after online publication and is updated daily on week days.
Initial download of the metrics may take a while.