Fig. B.1
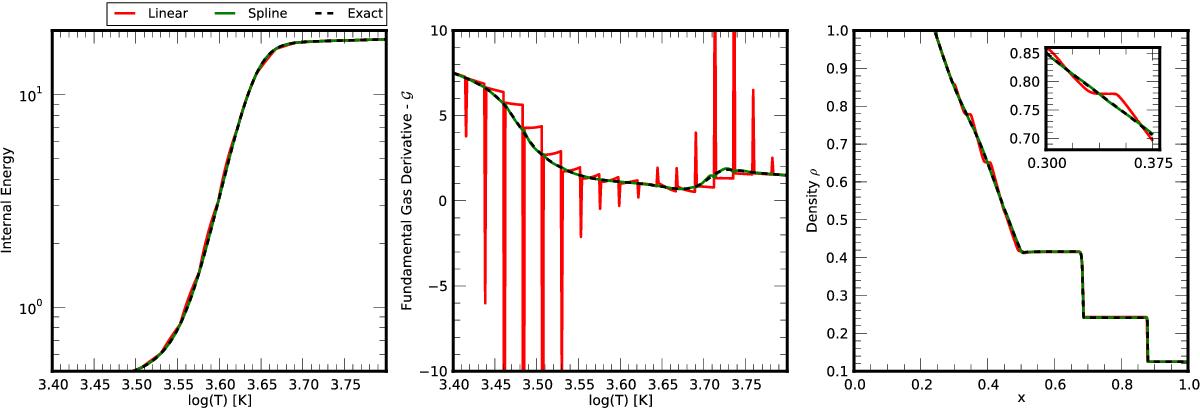
Comparisons between exact and tabulated approaches for the partially hydrogen gas
EoS. The black dashed line corresponds to computations obtained with the iterative
root-finder approach outlined in Sect. 3.2.1
while the red and green solid lines corresponds to the tabulated approach presented
in Sect. 3.2.2. Left: gas
internal energy (Eq. (B.1)) around
the transition region. Middle: fundamental gas derivative
![]() (Eq. (A.1)) computed using standard
central differencing. The large spikes in the red curve are due to discontinuous
first derivatives using linear interpolation between adjacent node values in the
table. Right: density profile in the Sod shock tube at
t =
0.2 using the exact and spline approaches. It is clear the
appearance of spurious compound structures in the rarefaction wave when a linear
spline is used to approximate the table.
(Eq. (A.1)) computed using standard
central differencing. The large spikes in the red curve are due to discontinuous
first derivatives using linear interpolation between adjacent node values in the
table. Right: density profile in the Sod shock tube at
t =
0.2 using the exact and spline approaches. It is clear the
appearance of spurious compound structures in the rarefaction wave when a linear
spline is used to approximate the table.
Current usage metrics show cumulative count of Article Views (full-text article views including HTML views, PDF and ePub downloads, according to the available data) and Abstracts Views on Vision4Press platform.
Data correspond to usage on the plateform after 2015. The current usage metrics is available 48-96 hours after online publication and is updated daily on week days.
Initial download of the metrics may take a while.