Fig. 6
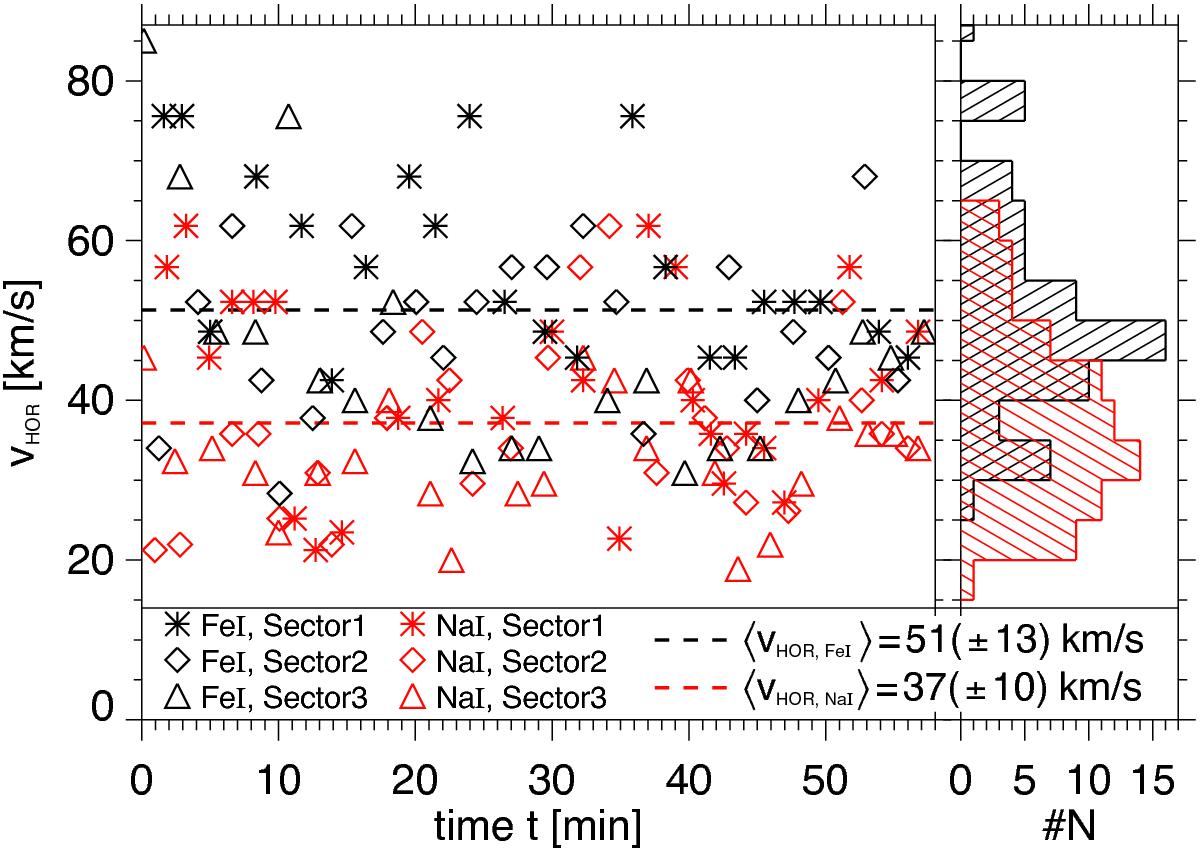
Apparent horizontal velocities, vHOR, of running penumbral waves at two atmospheric layers. The results for the photospheric Fe i line (Figs. 5d–f) are shown in black, for the chromospheric Na i line (Figs. 5a–c) in red. Left panel: the apparent horizontal velocities (in km s-1) over the first 4″ of the inner penumbra are plotted according to the observation time, t. The asterisks, diamonds, and triangles show the apparent speeds of the wave trains in sectors 1, 2, and 3. The dashed lines indicate the average apparent velocities, ⟨ vHOR, Fe i⟩ and ⟨ vHOR, Na i⟩ for both layers. The averages and their standard deviations are given in the figure legend. Right panel: histogram showing the number #N of velocity values vHOR from the left panel within a 5 km s-1 binning interval.
Current usage metrics show cumulative count of Article Views (full-text article views including HTML views, PDF and ePub downloads, according to the available data) and Abstracts Views on Vision4Press platform.
Data correspond to usage on the plateform after 2015. The current usage metrics is available 48-96 hours after online publication and is updated daily on week days.
Initial download of the metrics may take a while.